Modernizing Atlassian’s massive-scale observability infrastructure with OpenTelemetry

For nearly a decade, Atlassian’s global observability pipeline operated on a foundation of gostatsd, an open-source StatsD implementation managed internally by the company’s engineering teams. This system was the backbone of a sprawling infrastructure, processing telemetry from approximately 100,000 hosts across 14 geographic regions. Maintaining a 99.95% Service Level Objective (SLO) while managing minimal latency, the legacy system functioned as a silent, reliable workhorse. However, as the broader software industry converged on OpenTelemetry (OTel) as the de facto standard for observability data, Atlassian’s reliance on a bespoke, UDP-only architecture reached a critical inflection point. The company recently completed a multi-year effort to migrate this entire pipeline to an OpenTelemetry-native architecture, a move that promises to reduce infrastructure costs significantly while unifying the company’s approach to metrics, logs, and traces.
The Strategic Shift: Moving Beyond Legacy Limitations
The decision to migrate was driven by the widening gap between Atlassian’s legacy infrastructure and the modern OTel ecosystem. Gostatsd, while effective for its time, lacked native support for modern observability primitives like traces and logs. Furthermore, the rapid innovation within the OpenTelemetry community meant that Atlassian’s engineers were increasingly forced to "reinvent the wheel"—manually building features that were already available in the OTel Collector.
Recognizing that they were engaged in a losing race against the velocity of the open-source community, the engineering leadership at Atlassian, including Iris Grace Endozo, Farzad Vazirnia, and Albert Kerr, initiated a strategic transition. The fundamental challenge was not merely technical; it was organizational. Replacing an observability pipeline that is deeply integrated into thousands of services without incurring downtime or losing critical alerting data is a high-stakes operation. The team rejected the "big bang" approach—which would have required an organization-wide effort to re-instrument every service—in favor of a surgical, platform-level migration.
The Methodology: Transparent Infrastructure Transformation
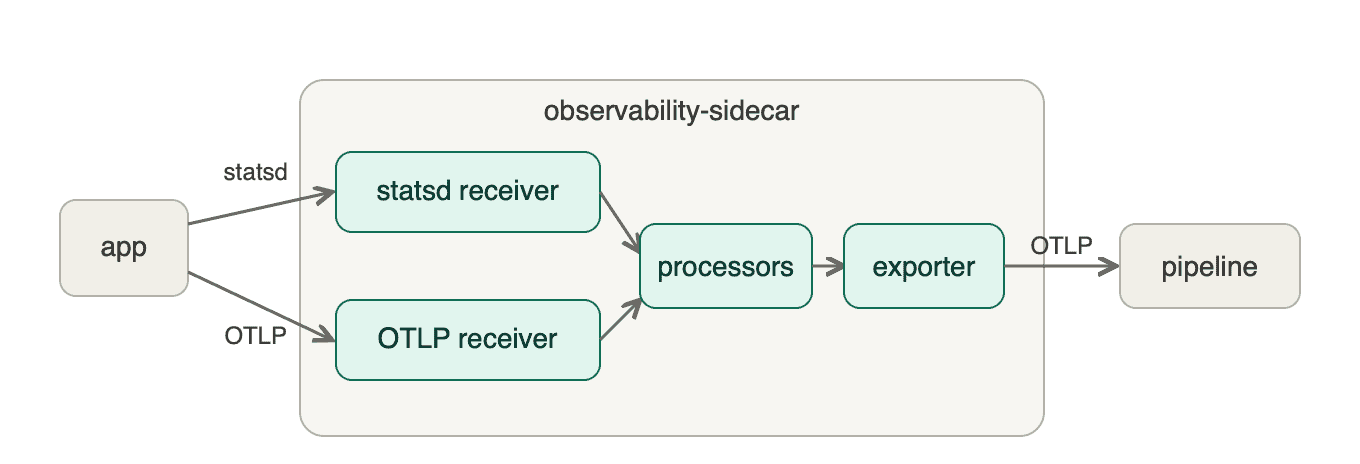
The core of Atlassian’s strategy was to decouple the "contract" of the metrics pipeline from its underlying engine. From the perspective of a service owner, the interface remained unchanged: applications continued to send StatsD data via UDP to a local address. By keeping this interface consistent, the platform team assumed the burden of the migration, sparing thousands of product engineers from needing to touch their instrumentation code during the initial phase.
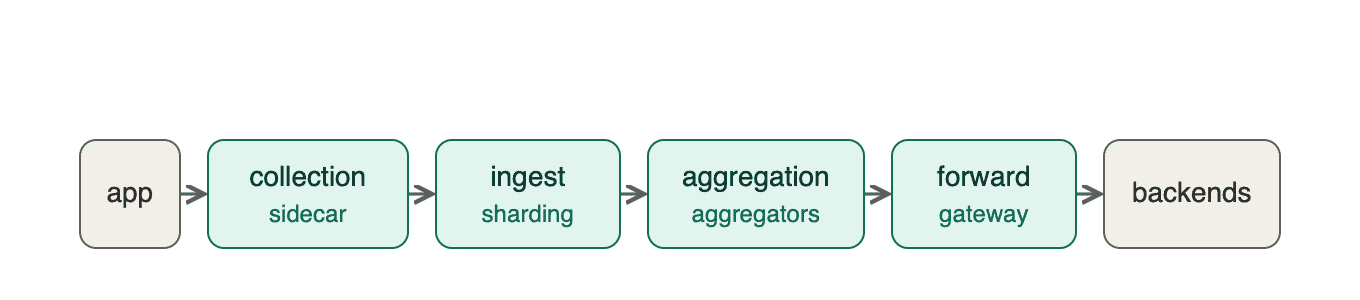
The architecture was broken down into four distinct stages: collection, ingestion, aggregation, and forwarding. By deploying purpose-built OpenTelemetry Collector distributions at each stage, the team gained the flexibility to iterate on any component of the pipeline without disrupting the others. The transition was facilitated by the fact that Atlassian’s tracing team had already successfully deployed the OTel Collector for their own use cases, providing a pre-validated proof-of-concept for the scale and stability of the system.
Chronology of the Transformation
The migration followed a methodical, phase-by-phase rollout:
- Phase I: Sidecar Replacement. The initial step involved replacing the gostatsd sidecar on every host with an OTel Collector distribution. Because the new collector was configured to listen for the same StatsD traffic, the transition was invisible to application teams. This phase resulted in immediate efficiency gains, allowing for the decommissioning of redundant sidecars.
- Phase II: Ingestion Optimization. Atlassian moved away from an in-house proxy, known as "nomad," which previously hashed traffic based on service and environment. This method often created "hot shards" when a large service dominated the traffic. By adopting the OpenTelemetry
loadbalancingexporterand hashing bystreamID(the unique identity of an individual time series), the team achieved a more uniform distribution of load, significantly improving the stability and scaling behavior of the ingestion tier. - Phase III: Aggregation and Efficiency. The aggregation tier, responsible for reducing roughly 4.8 billion data points per minute down to 220 million, underwent a major overhaul. By implementing a custom delta aggregation processor—which was subsequently open-sourced via the Atlassian-labs GitHub repository—the team significantly reduced the CPU overhead of the aggregation tier.
- Phase IV: Gateway and Serverless Integration. The final hop, previously handled by a bespoke internal forwarder, was replaced by a stateless collector distribution. Additionally, the team developed an OTel Lambda extension to provide coverage for serverless environments, ensuring that the entire pipeline could function without requiring manual code changes in serverless functions.
Quantifiable Impact and Performance Metrics
The economic and operational impacts of this migration are substantial. By folding metrics into the existing tracing sidecar, Atlassian realized a 3.9% reduction in CPU utilization per service on average, equating to roughly a 30% cut in sidecar costs across the fleet. The ingestion tier, previously plagued by uneven load distribution, now benefits from a flatter, more efficient scaling profile, which allows for tighter autoscaling bands and more reliable off-peak performance.
Perhaps most importantly, the removal of the legacy gostatsd aggregators and the "nomad" proxy—which previously accounted for approximately 38% and 13% of total resources in the metrics clusters, respectively—has yielded significant cost savings. This shift validates the "build vs. buy" decision, as the organization now relies on community-vetted collectors that provide native support for retries, queuing, and backpressure, features that previously required custom development.
Broader Implications for Observability
Atlassian’s migration highlights a growing trend among enterprise-scale technology companies: the standardization on OpenTelemetry as the universal observability framework. For the Cloud Native Computing Foundation (CNCF), which oversees the OpenTelemetry project, Atlassian’s successful adoption at this scale serves as a powerful endorsement of the project’s maturity and scalability.
By moving to a unified, OTel-based codebase, Atlassian has essentially transformed its observability pipeline from a bespoke monolith into a modular, configurable system. Adding new functionality to the pipeline is now a matter of configuration rather than service development. This architectural flexibility is crucial for long-term sustainability, as it allows the company to integrate new backends or data processing requirements without re-architecting the system.
Future Outlook: Shifting Left
With the core infrastructure now unified, the next phase for Atlassian is to "shift left"—transitioning the actual instrumentation within services away from vendor-specific and in-house clients, such as Datadog/DogStatsD, toward the standard OpenTelemetry SDK.
This final step will complete the modernization effort, giving developers full control over their telemetry data and reducing vendor lock-in. As Atlassian continues to lean into the OTel ecosystem, the company intends to contribute back to the community, leveraging its massive scale to help refine and harden the project for other organizations. The success of this transition underscores a fundamental reality of modern infrastructure: as the scale of data grows, the reliance on proprietary, bespoke tooling becomes a bottleneck, while standardization on open, community-driven frameworks provides the necessary agility to navigate an increasingly complex technological landscape.
Related posts: