
The New Mathematics of Venture Capital: Why Scaling From $1M to $100M ARR in Five Years is the Non-Negotiable Standard for Founders

The venture capital ecosystem is undergoing a profound structural realignment, shifting the foundational expectations for early-stage and growth-stage companies. For founders, venture capitalists, and institutional investors who cut their teeth in the pre-AI era, a central and pressing question dominates boardroom discussions: Is the legendary T2D3 growth model officially dead?
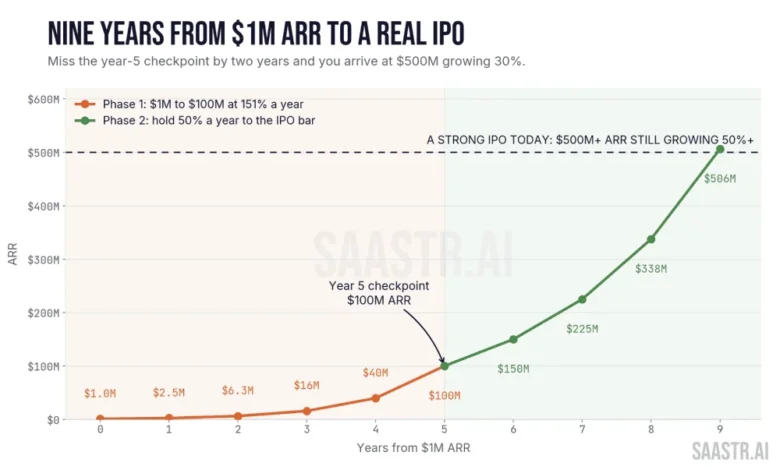
Historically, Neeraj Agrawal of Battery Ventures coined the T2D3 framework—triple, triple, double, double, double—as the canonical blueprint for venture-backed enterprise software success. In today’s hyper-accelerated, AI-driven market, that trajectory is no longer sufficient. Founders are finding that the new baseline for securing venture capital requires scaling from $1 million in Annual Recurring Revenue (ARR) to $100 million ARR in five years or less.
This translates to a compounding annual growth rate (CAGR) of roughly 151% over five consecutive years. While early-stage capital remains relatively patient—seed rounds continue to be priced primarily on founding teams, initial product wedges, and early market signals—the institutional clock aggressively starts the moment a startup hits the $1 million ARR milestone.
Deconstructing the New Growth Hurdle
To fully grasp the magnitude of this shift, one must examine how market dynamics have evolved over the past decade. The traditional T2D3 framework actually outperforms the new 151% compounding curve through the first three years due to the aggressive initial tripling effect. However, T2D3 ultimately lags in the final years, culminating at roughly $72 million ARR—falling about 28% short of the modern benchmark.
Consequently, T2D3 has not necessarily vanished; rather, it has been demoted. What was once considered the aspirational, top-decile performance path in 2016 now serves as the mandatory minimum threshold for venture backing today.
Crucially, this compressed timeline is not an arbitrary metric manufactured by venture capitalists seeking outsized returns. Instead, the growth bar is strictly dictated by the realities of public market exits and the subsequent valuation multiples across every preceding funding stage.
The Public Market Reality and Compression of Multiples
The shifting revenue requirements for startups are directly tied to the current state of software Initial Public Offerings (IPOs). According to Sapphire Ventures’ recent Software x AI market reports, the prevailing IPO calculus demands companies to achieve between $400 million and $500 million-plus in annual revenue, maintain a growth rate of 20% or more at scale, demonstrate positive free cash flow (or a clear, credible path toward it), and present a defensible, compelling AI strategy. For a strong, high-performing public debut where aftermarket trading acts as a valuation floor rather than a ceiling, those numbers scale even higher to $500 million-plus in revenue growing at 50% or more.
Recent market data underscores how unforgiving public investors have become regarding deceleration. When design software giant Figma priced its IPO in July 2025 at a valuation of approximately $19.3 billion, it did so on the back of $749 million in 2024 revenue growing at 48%, alongside 91% gross margins and robust net income. Yet, when Figma reported its first public quarter reflecting a growth rate of 41%, the market swiftly punished the stock, shedding roughly 20% of its market capitalization the following day. Public market participants demonstrated that even highly profitable, category-defining giants are subject to immediate repricing upon signs of growth moderation.
This public market sensitivity is exacerbated by compressed revenue multiples. Even the fastest-growing enterprise software companies—those maintaining 25% or greater revenue growth—are trading at roughly 8.3x Next Twelve Months (NTM) revenue, a significant discount compared to the 10-year historical average of 10.8x. Public enterprise software indices have faced severe corrections, reflecting a structural repricing rather than a mere tracking of broader macroeconomic tech downturns.

Cascading Valuation Pressures Down the Funding Ladder
The contraction in public market multiples inevitably cascades down through every tier of private venture financing. Series C, Series B, and Series A investors underwrite future exits based on terminal values. If a public exit at $400 million in revenue yields a compressed valuation due to lower market multiples, early-stage investors must demand higher revenue generation at the point of exit to secure their target fund returns. Consequently, they push those rigorous revenue requirements down to the Series B and Series A milestones.
Data from Carta illustrates the drastic escalation in entry barriers. The median Series A benchmark for artificial intelligence startups has surged significantly, with median rounds ranging from $13 million to $15 million on post-money valuations between $75 million and $250 million. In this environment, capturing a typical venture ownership stake of 15% to 20% at Series A—which dilutes down to roughly 7% to 10% by the time of an exit—means that a startup must achieve multi-billion-dollar valuations to return a meaningful multiple to its early backers. At an 8x revenue multiple, a multi-billion-dollar valuation requires sustained, massive top-line scale, cementing the necessity of the $1 million to $100 million in five years trajectory.
The Rise of Private Equity and the Divergence of Software Listings
The stringent demands of venture capital have triggered a notable shift in how mature software companies approach liquidity. A prime example is Entrata, which filed to go public with more than $509 million in annual revenue growing at 24%. While undeniably an exceptional, cash-flow-positive enterprise and a recognized leader in multifamily property management software, Entrata represents a wave of private equity (PE)-sponsored software listings rather than traditional venture-backed debuts.
Buyout funds operate under defined lifecycles and structured LP distribution schedules, compelling them to bring mature, steadily growing assets to the public markets. Conversely, venture-backed companies compounding at 40% to 50% year-over-year have the operational flexibility to remain private longer, raise private growth rounds, or utilize continuation vehicles. For founders whose businesses stabilize into steady 20% to 30% growth profiles rather than hyper-growth curves, private equity or growth equity increasingly serves as a more natural funding destination than traditional venture capital.
Exceptions to the Rule: Infrastructure, Consumption, and Retention
While the five-year, 100x ARR rule serves as the dominant framework for mainstream B2B SaaS and AI applications, certain structural exceptions persist across specific technology sectors.
- Infrastructure and Deep Tech: Highly technical categories and foundational infrastructure products often require multi-year research and development phases before commercial deployment. When initial enterprise contracts scale into seven figures, sophisticated institutional investors are often willing to underwrite a slower initial ramp toward $100 million in exchange for a vastly larger and more defensible terminal market opportunity.
- Usage-Based and Consumption Models: Companies operating on consumption-based pricing models frequently report raw revenue rather than traditional ARR. These revenue shapes can appear flat for consecutive quarters before experiencing exponential, step-function growth as major enterprise clients transition heavy workloads into active production. Applying rigid ARR timelines to consumption models can yield misleading analytical conclusions.
- Exceptional Unit Economics: Robust net revenue retention (NRR) and rapid customer acquisition cost (CAC) payback periods can occasionally buy a company operational breathing room. A firm generating $12 million ARR growing at 55% with a 135% NRR and a 12-month payback period remains highly fundable at the Series B stage, whereas the same growth rate with sub-100% retention faces steep capital hurdles.
Strategic Takeaways for Modern Founders
Navigating this compressed fundraising landscape requires founders to align their operational trajectory with their capital strategy early in their lifecycle. For companies operating below the $1 million ARR threshold, the primary focus must remain on product-market fit and refining the core sales wedge rather than forcing premature top-line acceleration.
However, for founders who have recently crossed the $1 million ARR mark, disciplined milestone tracking is essential. Recognizing within the first 18 months whether a go-to-market motion compounds at an aggressive 150% or a more moderate 60% allows leadership teams to select the appropriate capital structure deliberately. Founders operating in the challenging middle tier—such as $10 million to $30 million ARR growing at 40% to 60%—often find themselves caught in a mismatch between standard private business performance and the aggressive requirements of modern venture funds. For these leaders, exploring alternative capital pathways, including strategic minority investments, growth equity, or achieving cash-flow self-sufficiency, provides a pragmatic alternative to prolonged and often unsuccessful venture fundraising cycles.