Navigating the Rollercoaster: A 25-Year Retrospective of the U.S. Domestic Freight Market

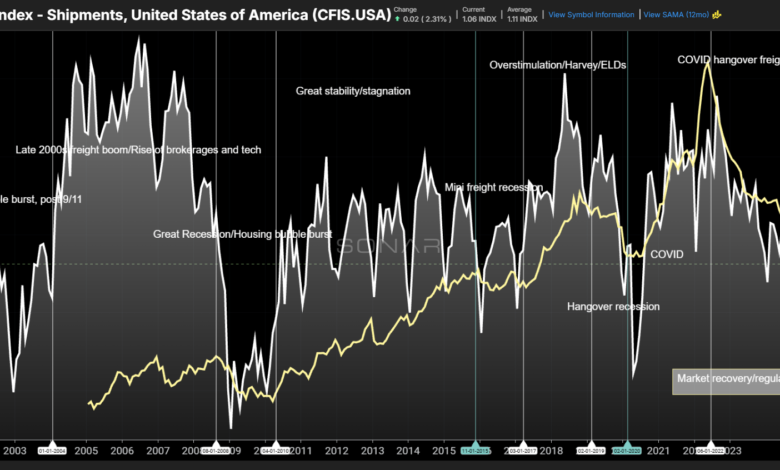
The domestic freight market has experienced an unprecedented economic rollercoaster since the turn of the century, shifting from predictable seasonal rhythms to unprecedented structural shocks. Comprehensive logistics benchmarks—specifically the Cass Freight Shipments Index (CFIS) and the Cass Truckload Linehaul Index (CTLI)—illustrate how fundamentally each succeeding market cycle has diverged from its predecessor. These divergent trajectories underscore a central challenge for modern supply chain management: predicting the precise ignition and termination points of freight cycles has become extraordinarily difficult.
To understand the macro-level forces governing the movement of goods, industry analysts rely heavily on these two foundational metrics. The CFIS tracks shipment volumes across multiple transport modes, including truckload, intermodal, less-than-truckload (LTL), and various smaller shipping methods. Because the index aggregates actual invoice data rather than speculative bookings, it serves as one of the most reliable macroeconomic representations of total domestic transportation demand over time, though it inherently operates with a slight reporting lag.
Conversely, the CTLI measures the base cost of a standard truckload move, carefully isolating pricing metrics by excluding volatile variables such as fuel surcharges and accessorial fees. By stripping away external energy price fluctuations, the CTLI provides a clean gauge of pure truckload pricing power, making base rates an exceptionally clear indicator of the fundamental supply and demand dynamics shifting beneath the surface of the domestic surface transportation sector.
Examining the interplay between consumer demand via the CFIS and truckload pricing power via the CTLI over the past quarter-century reveals several distinct eras, punctuated by massive structural anomalies that permanently altered how supply chains operate.
The Intra-Recession Era: Dot-Com Shocks and the Housing Boom
The dawn of the 21st century immediately tested the resilience of the North American supply chain network. Beginning in the year 2000, the CFIS captured the cascading early effects of the dot-com market collapse, followed swiftly by the profound economic fallout and security shocks of the September 11 terrorist attacks. As the broader U.S. economy officially slipped into a recessionary period, consumer and industrial goods demand remained muted significantly longer than the overarching macroeconomic indicators suggested.
The subsequent recovery paved the way for 2004, which ultimately registered as one of the most robust economic growth years in modern history. Aggressive monetary policy, characterized by historically low interest rates following the sluggish start to the decade, ignited a massive residential housing boom. This construction surge was further supercharged by the burgeoning, high-risk subprime mortgage market that would eventually seed the financial crisis later in the decade.
During this frantic 2004 expansion, crude oil and diesel fuel prices began their historic ascent into extreme volatility, while real U.S. Gross Domestic Product expanded at an impressive clip of approximately 3.8%. High consumer goods demand colliding with constrained trucking capacity created a fertile environment for the rapid professionalization and expansion of freight brokerages. Brokerages evolved far beyond simple backhaul optimization plays for asset-owning carriers, adopting sophisticated new software technologies that became widely accessible as the commercial internet matured. This expanding digital connectivity enabled smaller regional carriers to seamlessly haul freight for Fortune 500 shippers, catalyzing a massive expansion of independent owner-operators that shaped industry demographics for the next ten years.
This expansionary cycle abruptly halted in 2008 when the speculative housing bubble burst, triggering the global financial crisis known colloquially as the Great Recession. Industrial production ground to a halt, and severe freight weakness lingered well into 2010. By early 2011, however, the broader U.S. economy found its footing, embarking on a prolonged period of slow, deliberate, but remarkably steady macroeconomic growth that persisted for the next five years.
The Great Stabilization and the Illusion of Normalcy
The post-recession window spanning from 2011 through 2015 represented the most tranquil, predictable period of the past 26 years. For many logisticians, corporate shippers, and carrier executives, this half-decade established the baseline definition of what "normal" market conditions looked like. During this era, the CFIS adhered to a remarkably crisp, reliable 12-month seasonal pattern, while truckload base rates drifted upward at a modest, predictable pace of roughly 3% per year.
This fragile equilibrium shattered in late 2015 due to a dramatic collapse in global energy markets. The plunging cost of crude oil triggered a localized "mini freight recession" that spanned most of 2016. Intriguingly, many industry participants failed to recognize the downturn in real-time, only identifying its contours in hindsight. U.S. economic growth decelerated sharply from roughly 4% in early 2015 to just 1.5% a year later, heavily impacting the domestic industrial manufacturing sector. Consequently, as freight demand faltered, truckload base rates contracted by approximately 2%.
The correction proved short-lived. By early 2017, excess carrier capacity had worked its way out of the system, industrial demand was roaring back, and the passage of the Tax Cuts and Jobs Act in December 2017 provided massive fiscal stimulus heading into 2018. The combination of accelerating consumer demand and rapidly shrinking physical capacity produced one of the most intense and prolonged spot-rate upswings in modern transportation history.
Exogenous shocks compounded the crunch: Hurricane Harvey devastated Gulf Coast refining and logistics infrastructure in the fall of 2017, while the federal mandate requiring commercial vehicles to adopt Electronic Logging Devices (ELDs) took effect that December, effectively restricting driver hours-of-service compliance and tightening available truck capacity. While many market participants dismissed the era as an unrepeatable "black swan" event, it signaled the end of predictable seasonality.
As historical precedent dictates, aggressive capacity expansion inevitably followed record-high spot rates. The corporate tax cuts delivered a powerful temporary economic "sugar high," while carriers rushed to scale their operations. Active motor carrier authorities surged by roughly 15% between early 2017 and early 2019, creating a massive oversupply of trucks just as macroeconomic momentum cooled.
The resulting 2019 freight recession precipitated some of the largest structural bankruptcies and closures of the century within the domestic transport sector. Prominent truckload carrier Celadon Group and historic LTL provider New England Motor Freight both abruptly shut their doors. These high-profile failures purged significant capacity from the market just months before an unprecedented, pandemic-driven demand shock altered global supply chains forever.
The COVID-19 Pandemic Disrupts Global Logistics
The COVID-19 pandemic represented the freight market’s second major black-swan disruption within a compressed three-year window, decisively disproving the notion that such catastrophic disruptions are statistical rarities. Massive federal monetary stimulus, direct consumer relief checks, enhanced unemployment benefits, and a sudden, mandatory shift toward remote work catalyzed an unprecedented surge in physical goods consumption. This explosive demand collided with severe, structural supply chain bottlenecks across ports, warehouses, and intermodal yards.
Once again, this hyper-stimulated economic environment proved unsustainable, eventually giving way to a severe market correction. The subsequent downturn materialized as the longest sustained freight recession of the 2000s, stretching continuously from early 2022 through the conclusion of the 2025 holiday shipping season.
Logistics economists note that the market has now entered a brand-new cycle, though parsing its trajectory remains exceedingly complex. Current market signals demonstrate the futility of applying rigid timelines to modern freight cycles. Higher structural barriers to entry—driven by persistent regulatory pressures, elevated diesel fuel price baselines, and higher prevailing interest rates—are fundamentally reshaping how motor carriers operate.
Current economic indicators present a puzzling paradox: overall freight demand remains relatively subdued, yet the market exhibits clear inflationary characteristics. According to recent CTLI data, national truckload base rates climbed by an estimated 10% year-over-year in September, even as total freight shipping volumes rose by a meager 2%.
Strategic Implications for Corporate Leadership
The overarching lesson for modern enterprises is that the domestic freight market no longer operates within a vacuum. Logistics networks are deeply intertwined with geopolitical shifts, monetary policy, consumer behavior, and broader macroeconomic indicators. Corporate supply chain planners who build their long-term strategies around the assumption that the calm, low-inflation environment of 2010 to 2015 will eventually return are engaging in a dangerous miscalculation.
Historical data suggests that 12 months represents the absolute floor for how long any single freight cycle will endure. With shipment volumes still hovering near the bottom of their historical range, any unexpected positive macroeconomic surprise could easily extend the current contraction phase by several additional quarters. Furthermore, financial executives and corporate chief financial officers who are betting on aggressive, immediate rate relief in the near term are implicitly betting on a broader macroeconomic slowdown—and the corresponding damage to corporate revenues that such a contraction entails.
Related posts: