The question that stopped the meeting: How Adobe solved the invisible GPU cost crisis through CNCF-native observability

It was a routine infrastructure cost review meeting at Adobe in late 2025, a session intended to track operational expenses against allocated cloud budgets. When the screen displayed the monthly GPU expenditure—the largest single line item in the company’s infrastructure bill—a pointed five-word question brought the room to a standstill: “Are we using these things?”
The silence that followed was revealing. Despite massive investment in cutting-edge hardware to support AI and machine learning workloads, the engineering team could not verify if the expensive resources were actively processing data or sitting idle. The most costly hardware in the fleet was also the most opaque. This moment of uncertainty served as the catalyst for a fundamental architectural shift in how Adobe manages observability for its thousands of Kubernetes namespaces, leading to the development of a secure, tenant-centric metrics proxy.
The Visibility Gap: A Tale of Two Prometheus Instances
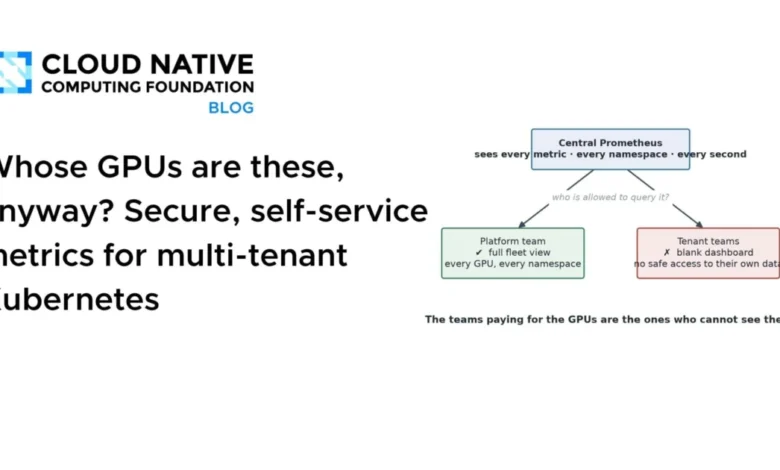
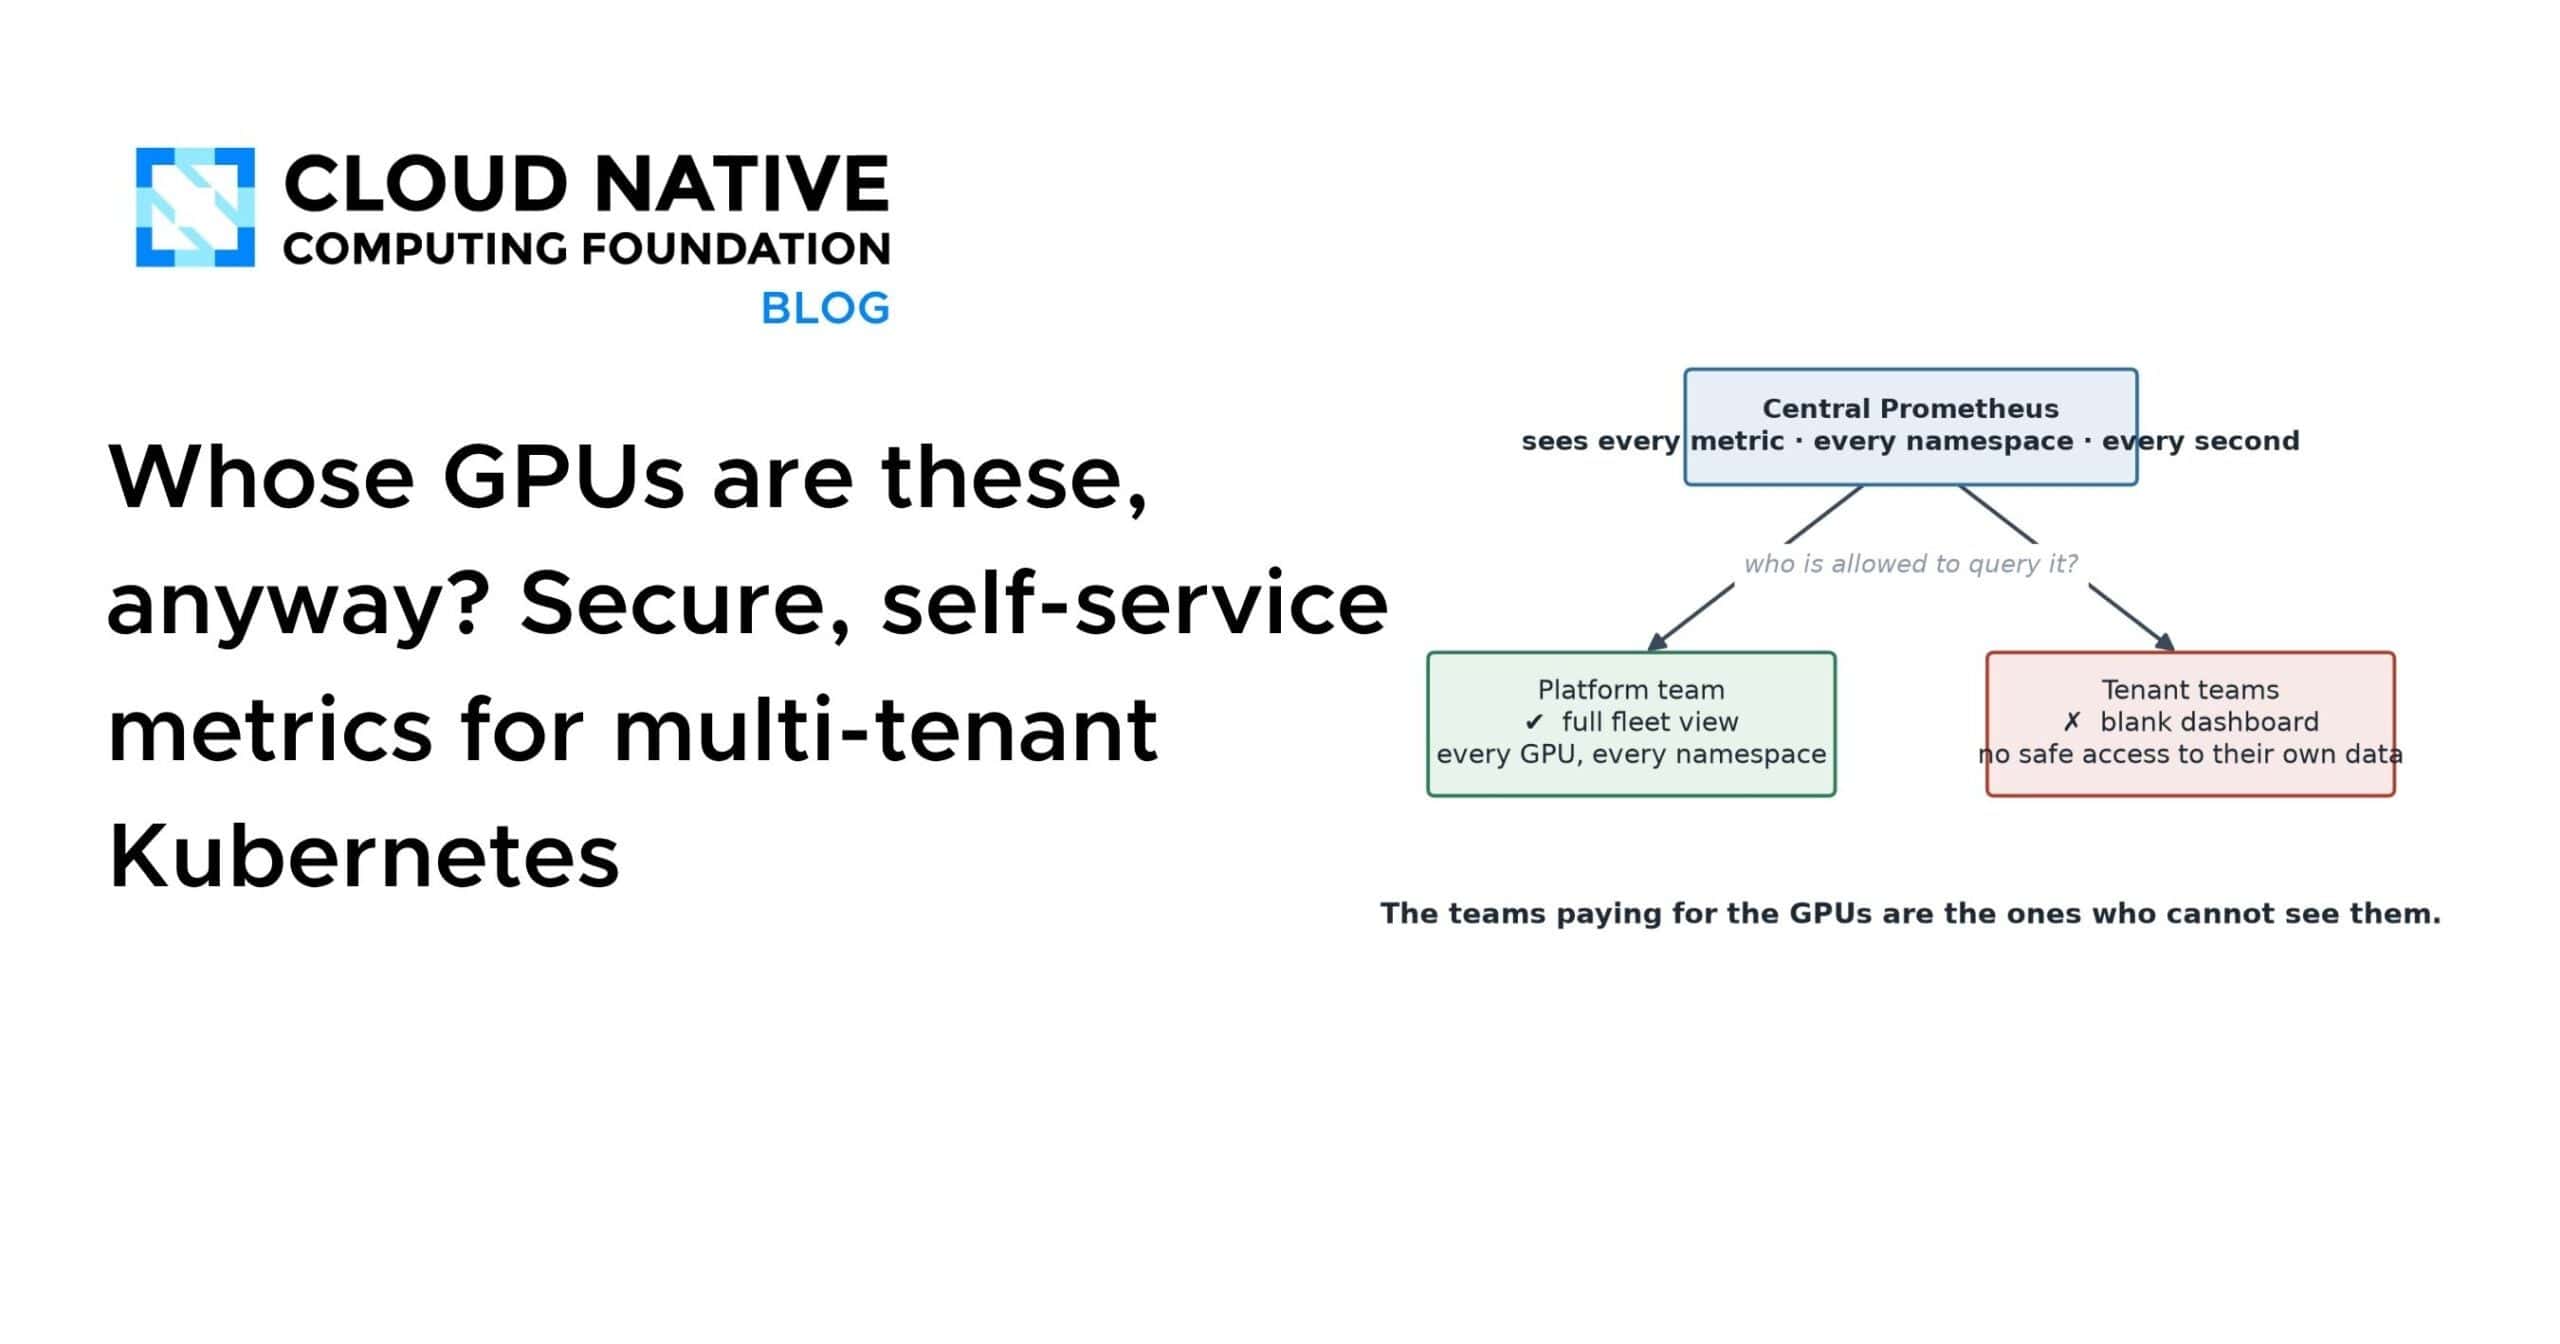
The paradox of the situation was that the data required to answer the question already existed. Every GPU in the fleet recorded its utilization metrics every second, and this granular data flowed into a central, infrastructure-owned Prometheus instance. However, this repository was a "black box" to the application teams.
Because the central Prometheus instance lacked namespace-aware access controls, it could not safely be exposed to individual tenants. Granting a single team access to the central store would have effectively granted them access to the capacity plans, request rates, and performance data of every other team in the organization. Consequently, visibility was bifurcated: platform engineers had the data but lacked the context of specific application needs, while application teams had the needs but lacked the data to optimize their resource footprint.
Investigations into this disconnect revealed alarming inefficiencies. The team discovered instances where GPUs had remained at zero percent utilization for eleven consecutive days. These units were fully allocated and powered on, yet they performed no work. Because these resources passed health checks, they appeared "healthy" to the system, effectively masking a significant monthly financial drain.
The Architectural Conflict: Security vs. Scalability
To resolve this, the platform engineering team, led by Golden Kubestronauts Bingi Narasimha Karthik and Ramkumar Nagaraj, initially considered the most straightforward solution: giving every team read access to the central Prometheus. They quickly identified two insurmountable obstacles that are common in large-scale Kubernetes environments.
First, the security posture was untenable. Prometheus query endpoints are not inherently namespace-aware. A tenant with access to the endpoint could execute PromQL queries that scrape data across the entire infrastructure, violating data sovereignty and security protocols.
Second, the "noisy neighbor" effect posed a severe risk to operational stability. Central Prometheus instances are already burdened by the ingestion of metrics for the entire fleet. If hundreds of engineers were to run ad-hoc queries against this shared store simultaneously, the increased load would lead to latency spikes, potentially destabilizing the monitoring of critical services.
Engineering a Solution: The Multi-Tenant Proxy
The team determined that the solution was not to build a new metrics stack, but to implement a specialized, tenant-aware abstraction layer. This design focused on three primary objectives: enforcing strict authentication, injecting namespace-level isolation into queries, and enabling self-service delivery for individual teams.
The resulting architecture utilizes a "librarian" model. Instead of allowing tenants to browse the entire library (the central Prometheus), the system acts as an intermediary. A tenant submits a request, and the proxy fetches only the relevant data, ensuring confidentiality and performance.
The Technical Implementation
The infrastructure operates on a clear distinction between the write path and the read path:
- Authentication and Authorization: The system uses
kube-rbac-proxyto handle identity verification. By leveraging Kubernetes-native RBAC, the system ensures that when a tenant makes a request, the user’s identity is anchored to their specific namespace. - Query-Time Isolation: To ensure that "everyone can read everything" is technically impossible, the team deployed
prom-label-proxy. This component automatically intercepts every incoming query and injects a namespace matcher. For example, a request forDCGM_FI_DEV_GPU_UTILis automatically rewritten toDCGM_FI_DEV_GPU_UTILnamespace="your-namespace". Because this happens below the query language level, the constraint cannot be bypassed by the user. - The MetricAccess Custom Resource: To achieve self-service, the team introduced a Kubernetes Custom Resource Definition (CRD) called
MetricAccess. This allows a team to define which metrics they require via a simple YAML declaration. The platform team manages the infrastructure, but the tenants define the policy for their specific data needs.
Data Efficiency and Financial Impact
The introduction of the metricIsolation feature resulted in a dramatic reduction in resource overhead. By filtering metrics at the collection stage rather than the query stage, the system only ingests the series relevant to a specific tenant.
Internal audits showed that for a typical tenant, this reduced the number of stored series by approximately 97%—dropping from over 10,000 global series to a few hundred namespace-specific series. This not only improved query performance by orders of magnitude but also significantly lowered the storage cost for individual Prometheus instances.
Operationalizing GPU Visibility
With the new system in place, teams can now run six key PromQL queries to identify and remediate idle capacity. These include:
- Average GPU utilization per namespace: Providing the high-level health metric teams previously lacked.
- Idle GPU detection: A specific query that identifies cards with less than 5% utilization over an hour, allowing teams to reclaim resources.
- Memory vs. Utilization ratios: Helping engineers distinguish between jobs that are "memory-bound" and those that are simply "reserved but empty."
- Power draw monitoring: Serving as a real-time proxy for the financial cost of the GPU workload.
- Anomaly detection: Identifying "hot cards" (high utilization) in instances where ingress traffic is silent, which often indicates a stuck or orphaned job.
Broader Implications for Kubernetes Observability
The work done by the Adobe team highlights a growing trend in cloud-native infrastructure: the movement toward decentralized, tenant-centric observability. By utilizing existing CNCF-native components—Prometheus, Nginx, and Kubernetes RBAC—the team avoided the vendor lock-in often associated with proprietary monitoring platforms.
The success of this initiative has broader implications for platform engineering teams managing large-scale, multi-tenant clusters. It demonstrates that the "noisy neighbor" problem and security concerns are not necessarily inherent to the technology but are often a result of how the infrastructure is configured. By moving isolation enforcement to the proxy level, organizations can provide developers with the granular visibility they need to optimize their own costs without compromising the integrity of the shared cluster.
A Path Forward for Platform Teams
The repository for the multi-tenant proxy, now open-sourced under the Apache 2.0 license, has become a point of interest for the broader Kubernetes community. The project underscores the value of "doing more with less"—achieving complex multi-tenancy requirements without the need for bespoke, unmaintainable monitoring stacks.
As of September 2026, the project serves as a case study in how targeted engineering interventions can solve systemic financial inefficiencies. The "reading room" analogy—where every team has access only to their own "notebooks"—has effectively transformed how Adobe manages its GPU fleet. Teams that were previously flying blind now have the tools to catch idle capacity within the hour, a change that has directly contributed to more efficient capital allocation across the organization.
The lessons learned by the Adobe team reinforce the importance of visibility. In a cloud-native world where resources can be spun up and down with a single command, the ability to see—and therefore govern—that consumption is no longer a luxury. It is a critical component of infrastructure management that ensures innovation remains both performant and fiscally responsible.