U.S. Rail Traffic Dips 3.7% in Mid-September Amid Softening Intermodal and Automotive Volumes

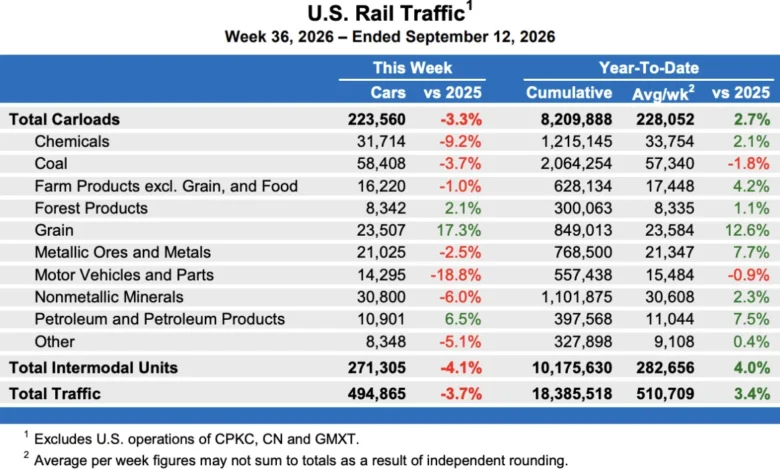
Weekly rail traffic across the United States experienced a downturn for the week ending September 12, driven primarily by declines in intermodal transport and specific commodity groups such as motor vehicles and parts. According to the latest data released by the Association of American Railroads (AAR), combined U.S. carload and intermodal originations fell 3.7% compared to the same period in the previous year, totaling 494,865 units.
While the weekly figures point to a brief cooling-off period for domestic freight transportation, cumulative numbers for the year remain in positive territory. Industry analysts note that short-term volatility in weekly reports is common as macroeconomic factors, manufacturing shifts, and seasonal supply chain adjustments influence freight movements across North America.
Breakdown of Weekly Rail Performance
The weekly report highlights a contraction across both major segments of rail freight: carloads and intermodal units.
Commodity freight traffic accounted for 223,560 carloads during the week ending September 12, marking a 3.3% decrease year-over-year. Concurrently, intermodal volume—consisting of containers and trailers—dropped 4.1% to 271,305 units, reflecting softer demand in consumer goods and retail supply chains.
A closer examination of the 10 distinct carload commodity groups tracked by the AAR reveals a stark divergence in performance across different industrial sectors. Only three of the 10 categories registered growth during the week:
- Grain: Up 17.3%, leading the gainers amid agricultural shipping cycles.
- Petroleum and Petroleum Products: Up 6.5%, driven by steady energy sector demands.
- Forest Products: Up 2.1%, showing modest resilience in construction-related materials.
Conversely, the remaining seven commodity groups suffered declines. The contraction was led sharply by the motor vehicles and parts sector, which plummeted 18.8% year-over-year. This steep drop underscores ongoing supply chain adjustments and production fluctuations within the automotive manufacturing industry. Other notable decliners included chemicals, which fell 9.2%, and nonmetallic minerals, which dropped 6.0%.
Cumulative Performance Remains Resilient
Despite the weekly setback, the broader picture for U.S. rail freight in 2026 demonstrates underlying resilience. For the first 36 weeks of the year, cumulative U.S. rail traffic has maintained a steady upward trajectory.
U.S. railroads reported a cumulative volume of 8,209,888 carloads through the first 36 weeks of 2026, representing a 2.7% increase compared to the same timeframe in 2025. Intermodal units performed even stronger, with 10,175,630 units recorded, marking a 4.0% year-over-year gain. Combined total traffic reached 18,385,518 carloads and intermodal units, translating into a solid 3.4% improvement over the previous year.

This cumulative growth suggests that while weekly data can fluctuate due to localized weather events, holiday timing, or temporary plant shutdowns, the overarching demand for rail transportation services has remained robust throughout the year.
Continental Trends Across North America
The rail traffic slowdown was not confined to the United States. Across North America, reporting railroads from the U.S., Canada, and Mexico also encountered downward pressure during the second week of September.
Combined weekly volume for the nine reporting North American carriers totaled 326,500 carloads, a 3.3% decrease compared to the corresponding week in 2025. Intermodal volume across the continent fell 3.8% to 353,081 units. In total, North American cross-border and domestic traffic reached 679,581 carloads and intermodal units, representing a 3.6% decline year-over-year.
Nevertheless, much like the U.S. domestic numbers, North America’s year-to-date figures remain positive. For the first 36 weeks of 2026, total continental volume reached 25,216,803 carloads and intermodal units, achieving a 3.0% gain over the same period in 2025.
Background and Macroeconomic Context
Rail freight traffic is widely regarded as a primary economic indicator, offering critical insights into the health of manufacturing, retail, agriculture, and energy sectors. When carloads of raw materials and industrial inputs rise, it typically signals expansion in factory production and mining. Conversely, fluctuations in intermodal volumes often mirror consumer spending habits, import volumes at major maritime gateways, and the efficiency of domestic warehousing networks.
The sharp drop in motor vehicles and parts traffic aligns with recent challenges in the automotive sector, where manufacturers have frequently adjusted production lines to manage inventory levels, component shortages, and the ongoing transition toward electric vehicle manufacturing infrastructure. Meanwhile, the strong performance in grain shipments reflects seasonal harvest patterns and robust export demands for U.S. agricultural commodities.
Industry Implications and Future Outlook
The mid-September traffic dip underscores the complex dynamics currently facing freight operators and logistics managers. While intermodal volumes have faced headwinds—potentially influenced by fluctuating import volumes and shifting retail inventory strategies—the consistent growth in year-to-date figures indicates that freight networks are successfully moving higher volumes overall compared to 2025.
Rail operators continue to invest heavily in technological innovations and infrastructure improvements aimed at reducing rail friction, enhancing terminal efficiency, and mitigating container delays at major U.S. ports. As the industry approaches the final quarter of 2026, stakeholders will be closely monitoring whether consumer demand picks up ahead of the peak holiday shipping season, which typically exerts a significant influence on intermodal traffic and carload distribution patterns.
The Association of American Railroads will continue to publish weekly and cumulative traffic data, providing policymakers, economists, and supply chain professionals with the transparent metrics necessary to navigate an evolving transportation landscape.