
Decoding the Stream: How Mux Data Is Transforming Video Quality Analytics Through Rendition-Level Insights

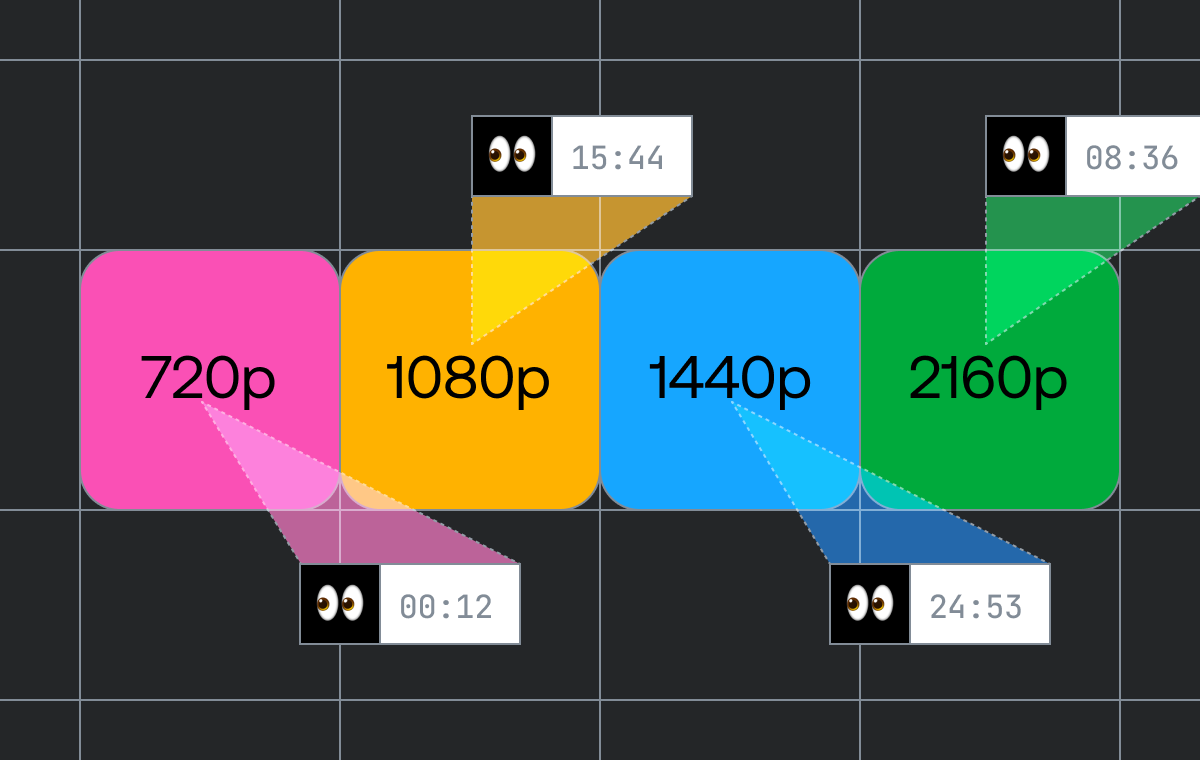
The modern landscape of digital video consumption is a heterogeneous ecosystem defined by extremes. Viewers stream high-definition content across an expansive array of hardware, ranging from high-powered desktop computers linked to robust fiber-optic networks to mobile devices tethered to fluctuating cellular signals inside subterranean transit systems. In the middle of this spectrum sit living room smart televisions, tablets, and gaming consoles, each presenting unique processing capabilities and network constraints. To navigate this chaos, the video streaming industry relies heavily on Adaptive Bitrate (ABR) streaming. ABR dynamically adjusts video delivery segment by segment, ensuring that a user on a fast broadband connection experiences pristine 4K resolution, while a user caught in a network bottleneck seamlessly drops down to 720p or lower without suffering from catastrophic buffering events.
However, this automated flexibility has long presented a fundamental analytics blind spot for content providers, broadcasters, and platform engineers. Historically, video publishers could easily inspect their encoding ladders to see what resolutions, bitrates, and codecs were available for a given asset, but they lacked deep, transparent insight into what was actually being consumed on the client side. Knowing that a 4K stream exists in a content library is entirely different from knowing how many cumulative hours of actual human viewing time were spent watching that 4K file versus lower-tier renditions. Addressing this critical information gap, Mux has introduced a powerful new analytical capability to its flagship monitoring suite: "Playing time by rendition." This advanced feature shifts the paradigm of video performance tracking, moving content providers away from speculative guesswork and toward precise, data-driven optimization.
The Technical Mechanics of Rendition Tracking
At its core, the logic governing ABR decisions resides entirely within the video player. Every media player—whether built on open-source frameworks like Shaka Player and Video.js or proprietary native applications—constantly assesses local device performance, available bandwidth, and network congestion to request the optimal video segment. During this continuous negotiation, the player collects granular metadata for every chunk of video delivered, tracking subtle shifts in bitrate, frame rate, codec utilization, video width, and video height.
Until recently, capturing and aggregating this wealth of client-side data at scale proved challenging for many video engineering teams. While Mux Player and the robust Mux Data SDKs have long possessed the underlying capability to ingest these metrics at a sub-view level, harnessing them required fragmented logging or custom internal dashboards. With the latest platform updates, Mux has streamlined this data collection pipeline. For organizations utilizing modern iterations of the Mux SDKs, the platform automatically begins aggregating playback metrics down to the individual rendition level. Organizations operating on legacy software versions can adopt standardized update pathways detailed in official technical documentation to bring their infrastructure up to date. Once current, engineering and product teams gain immediate access to a suite of analytical visualization tools designed to demystify real-world viewer consumption habits.
Measuring True Engagement Through Wall-Clock Time
One of the most significant methodological advantages of the "Playing time by rendition" metric is its reliance on wall-clock measurement rather than raw media timestamps. In traditional analytics, calculating viewing duration can often be skewed by variable playback speeds, user scrubbing, or instances where a video is skipped forward. Wall-clock measurement isolates actual human attention: if a viewer spends precisely five minutes actively watching a video stream, those five minutes are logged as five minutes of consumption, regardless of whether the content is playing at standard speed, whether the user paused the video to answer a phone call, or whether temporary rebuffering events temporarily halted playback.
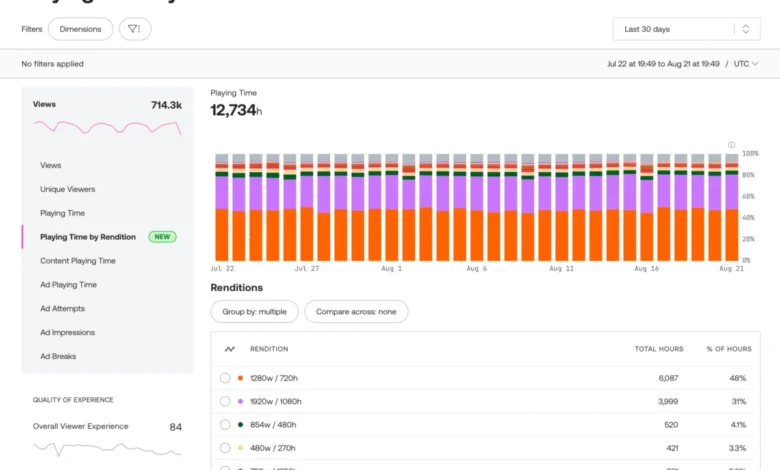
By filtering out inactive states such as pauses, buffering delays, and seeking operations, Mux provides video teams with an uncompromised representation of true viewer engagement. Within the Mux Data dashboard, this data manifests as a sophisticated time-series view. Stacked bar charts illustrate the proportional consumption of the top ten most frequently delivered renditions, with all remaining variations neatly consolidated into an aggregate "other" category. This visual hierarchy enables stakeholders to immediately evaluate how their encoding investments are performing in the wild. For instance, a media company that has recently invested heavily in rolling out ultra-high-definition 4K content can now accurately measure user uptake over a 30-day window, tracking whether viewers are genuinely experiencing the upgraded content or if network limitations are forcing the client players to default to legacy 1080p or 720p streams.
Granular Filtering and Segmented Audience Analysis
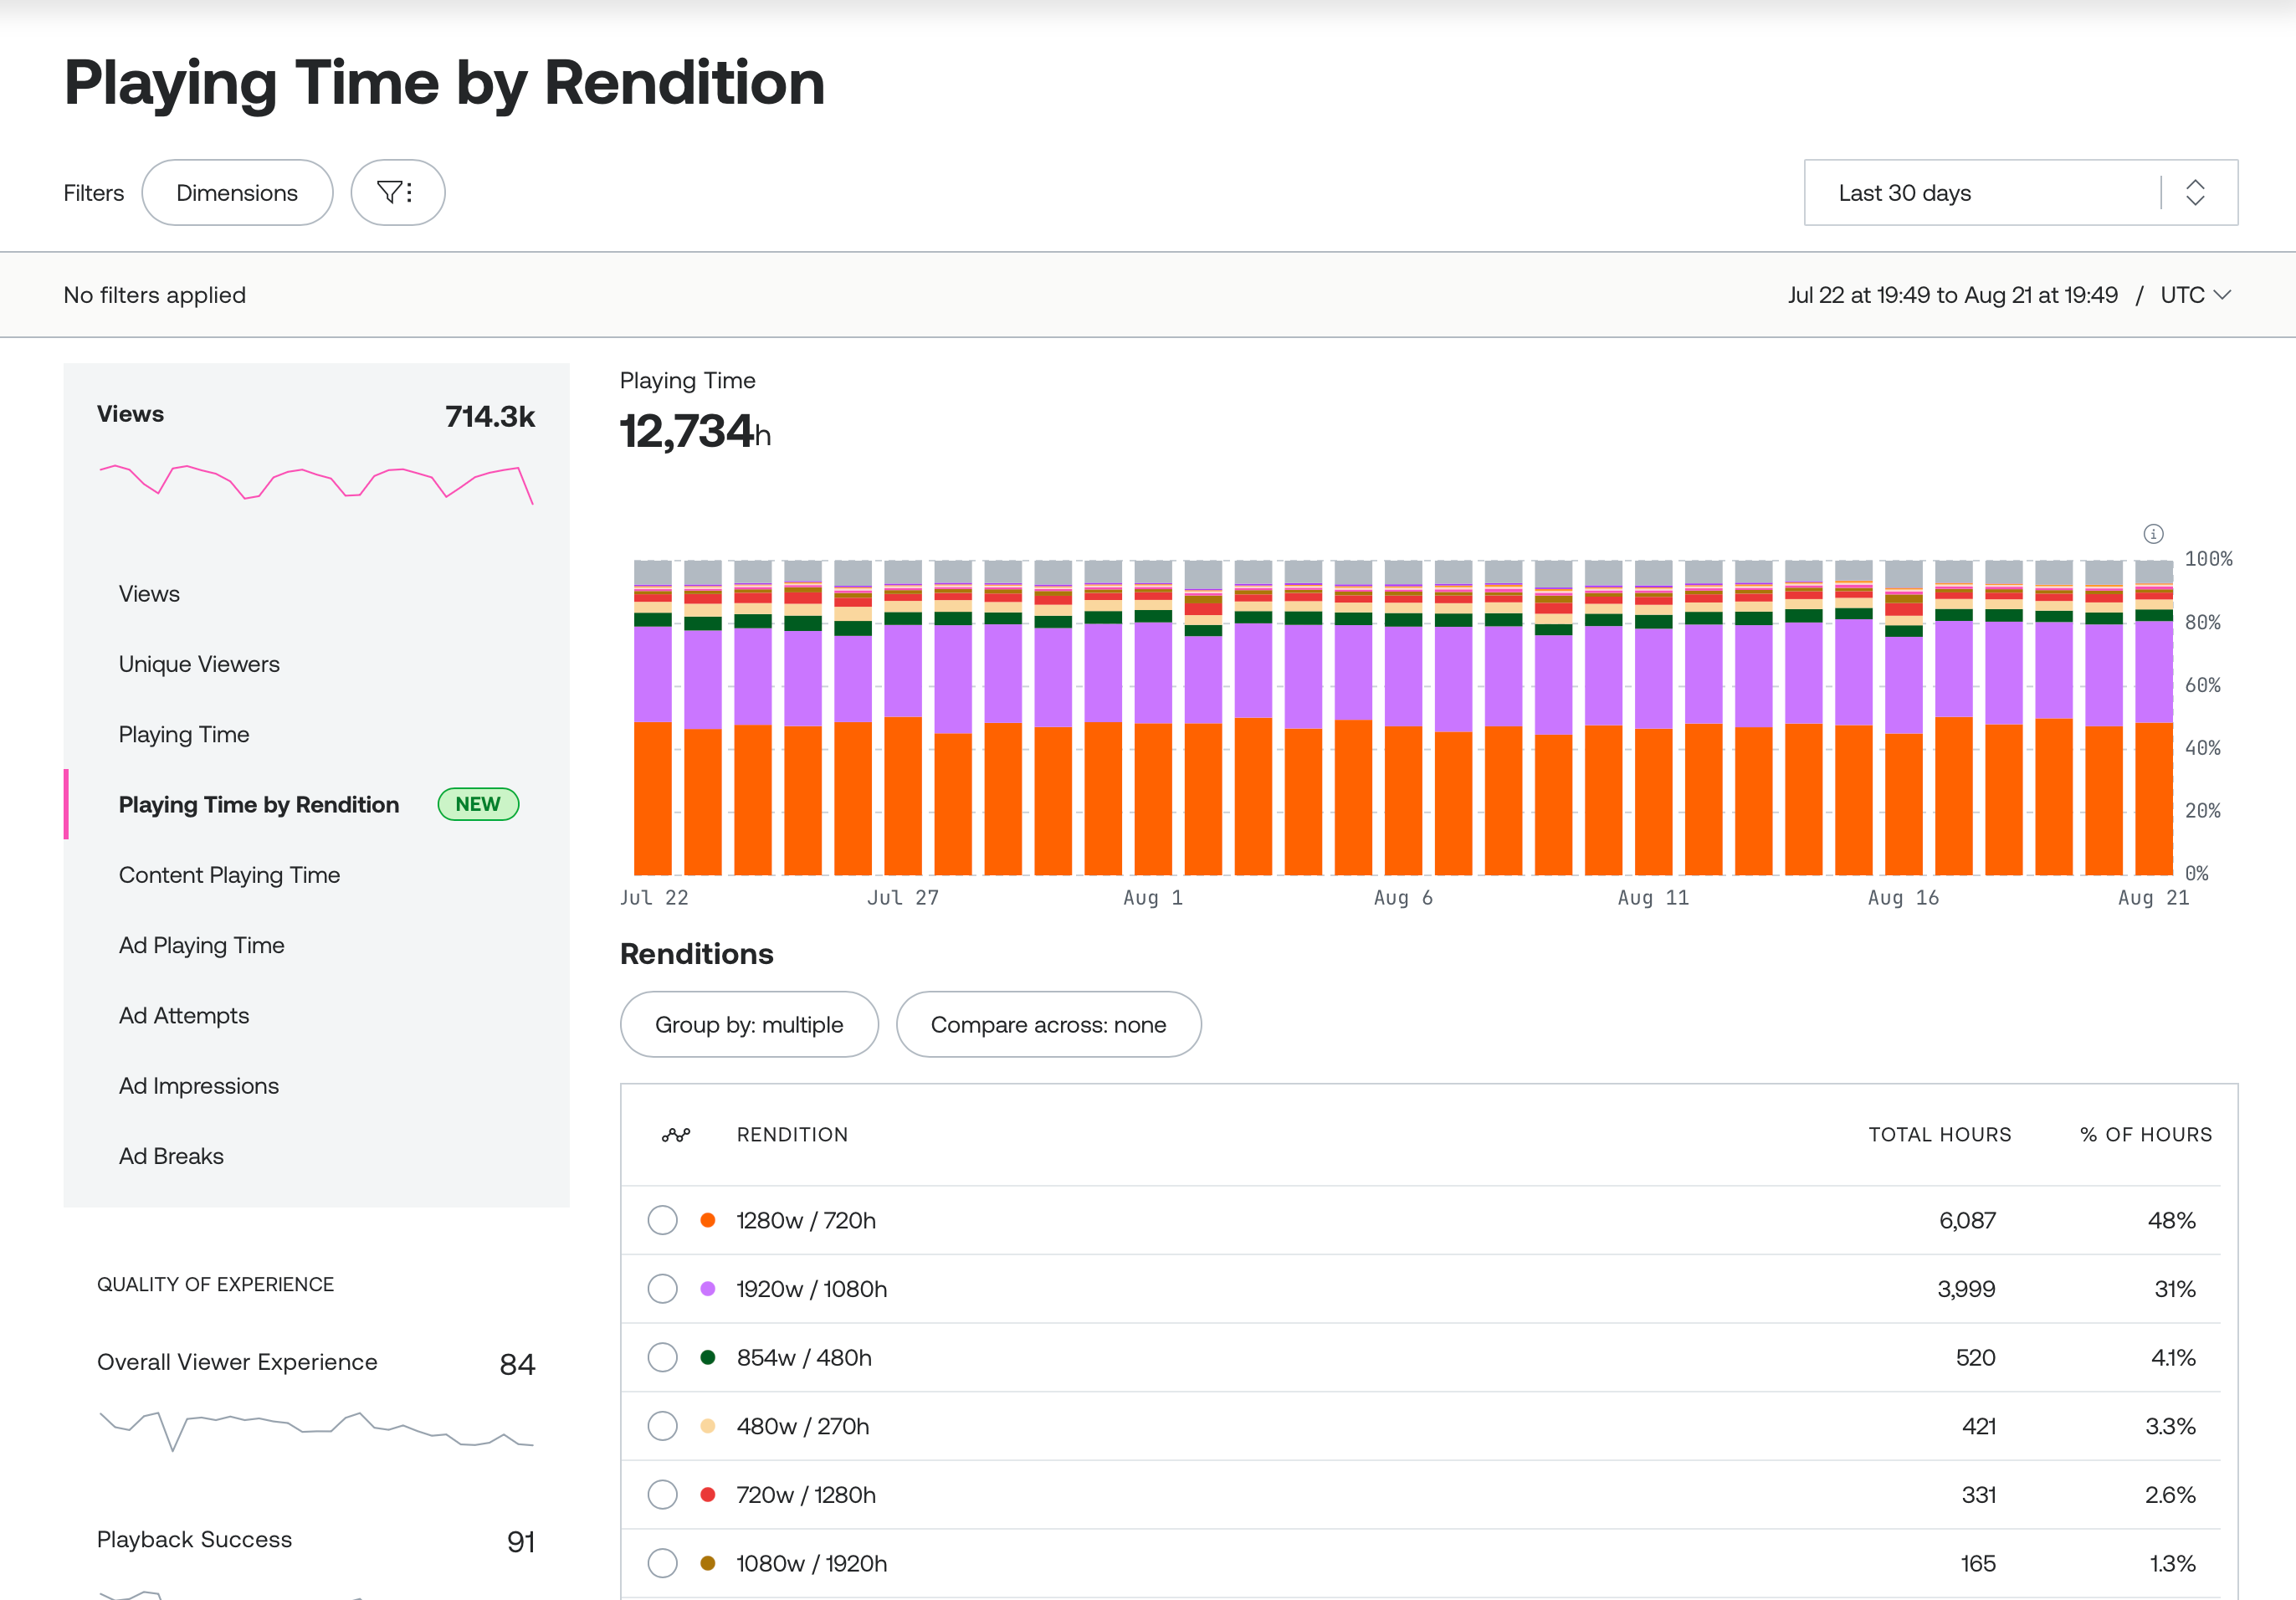
While aggregate consumption data provides a useful high-level overview, the true utility of rendition analytics emerges when teams apply granular filters. Modern media libraries frequently employ advanced encoding strategies such as per-title encoding or variable bitrate (VBR) optimization, resulting in a vast matrix of resolution, frame rate, and bitrate combinations across different assets.
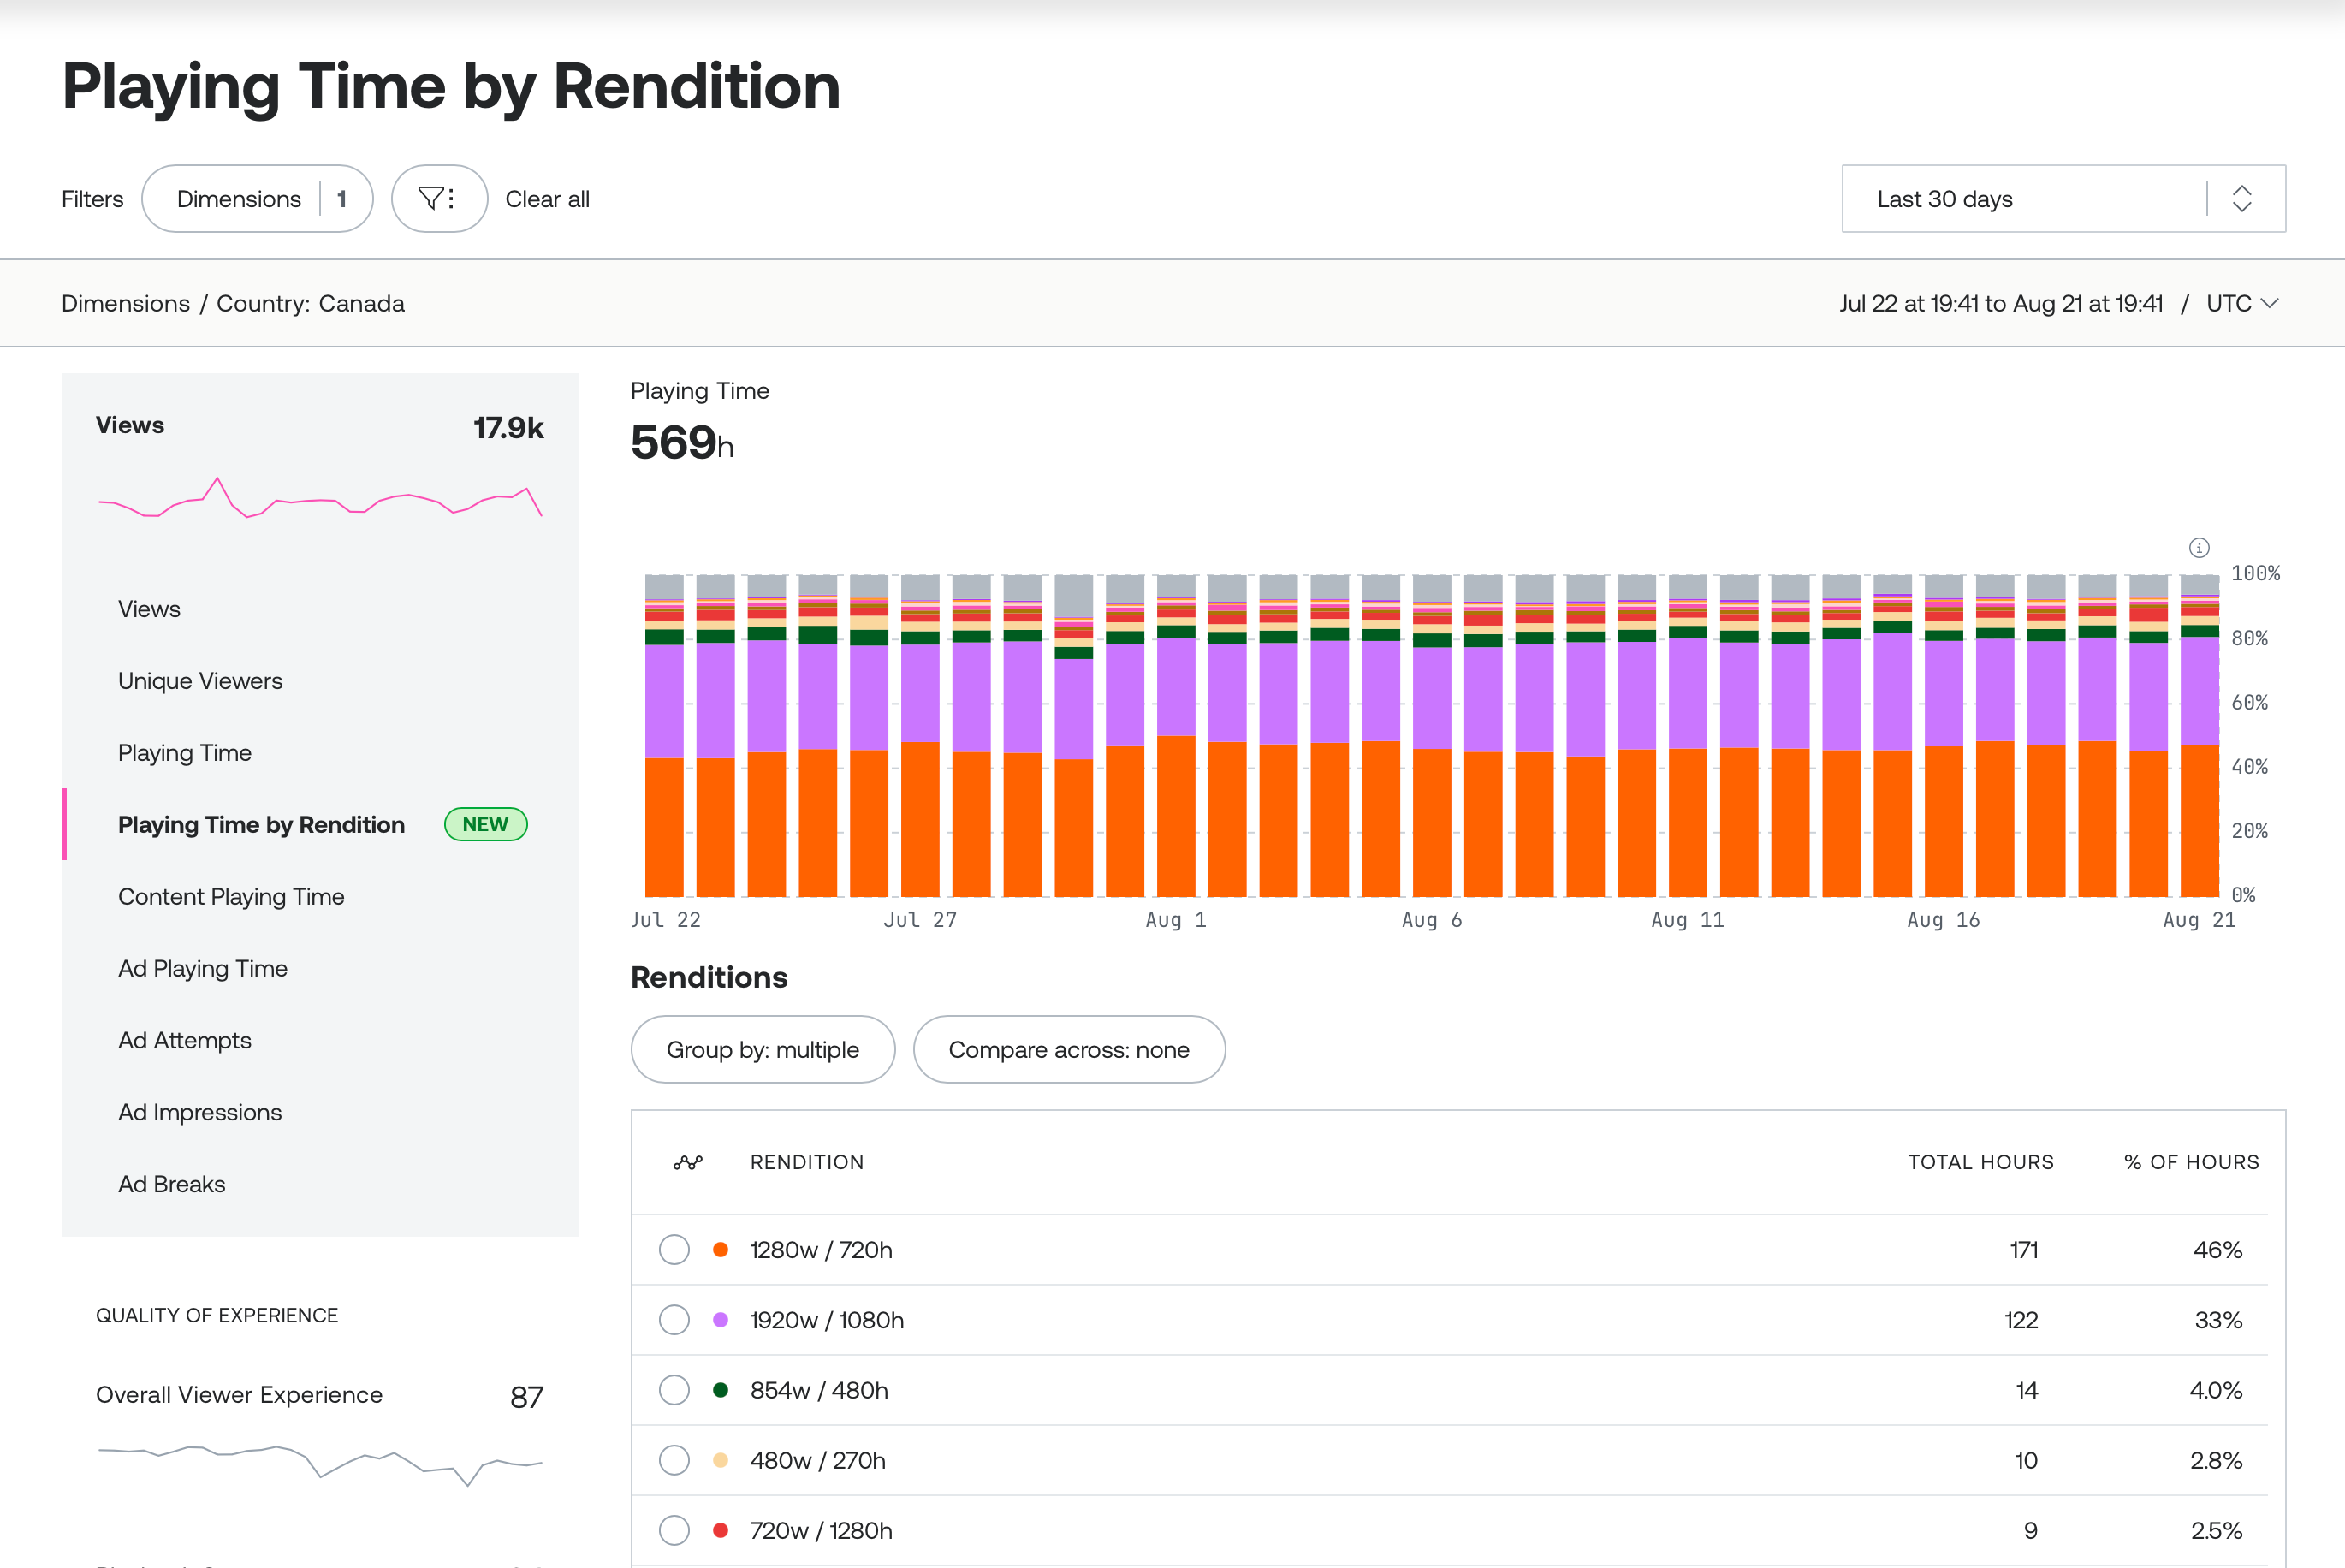
By applying targeted filters within the Mux Data interface, analysts can isolate viewing data by specific parameters such as individual titles, geographic regions, or device categories. This capability allows organizations to uncover stark regional disparities in network infrastructure and hardware adoption. For example, a global streaming service might discover that while users in metropolitan North American markets consume the vast majority of their favorite drama series at peak 1080p or 4K resolutions, viewers in developing markets or specific European regions spend a significantly higher percentage of their viewing time at 720p or lower due to local broadband constraints or mobile-dominant consumption habits.
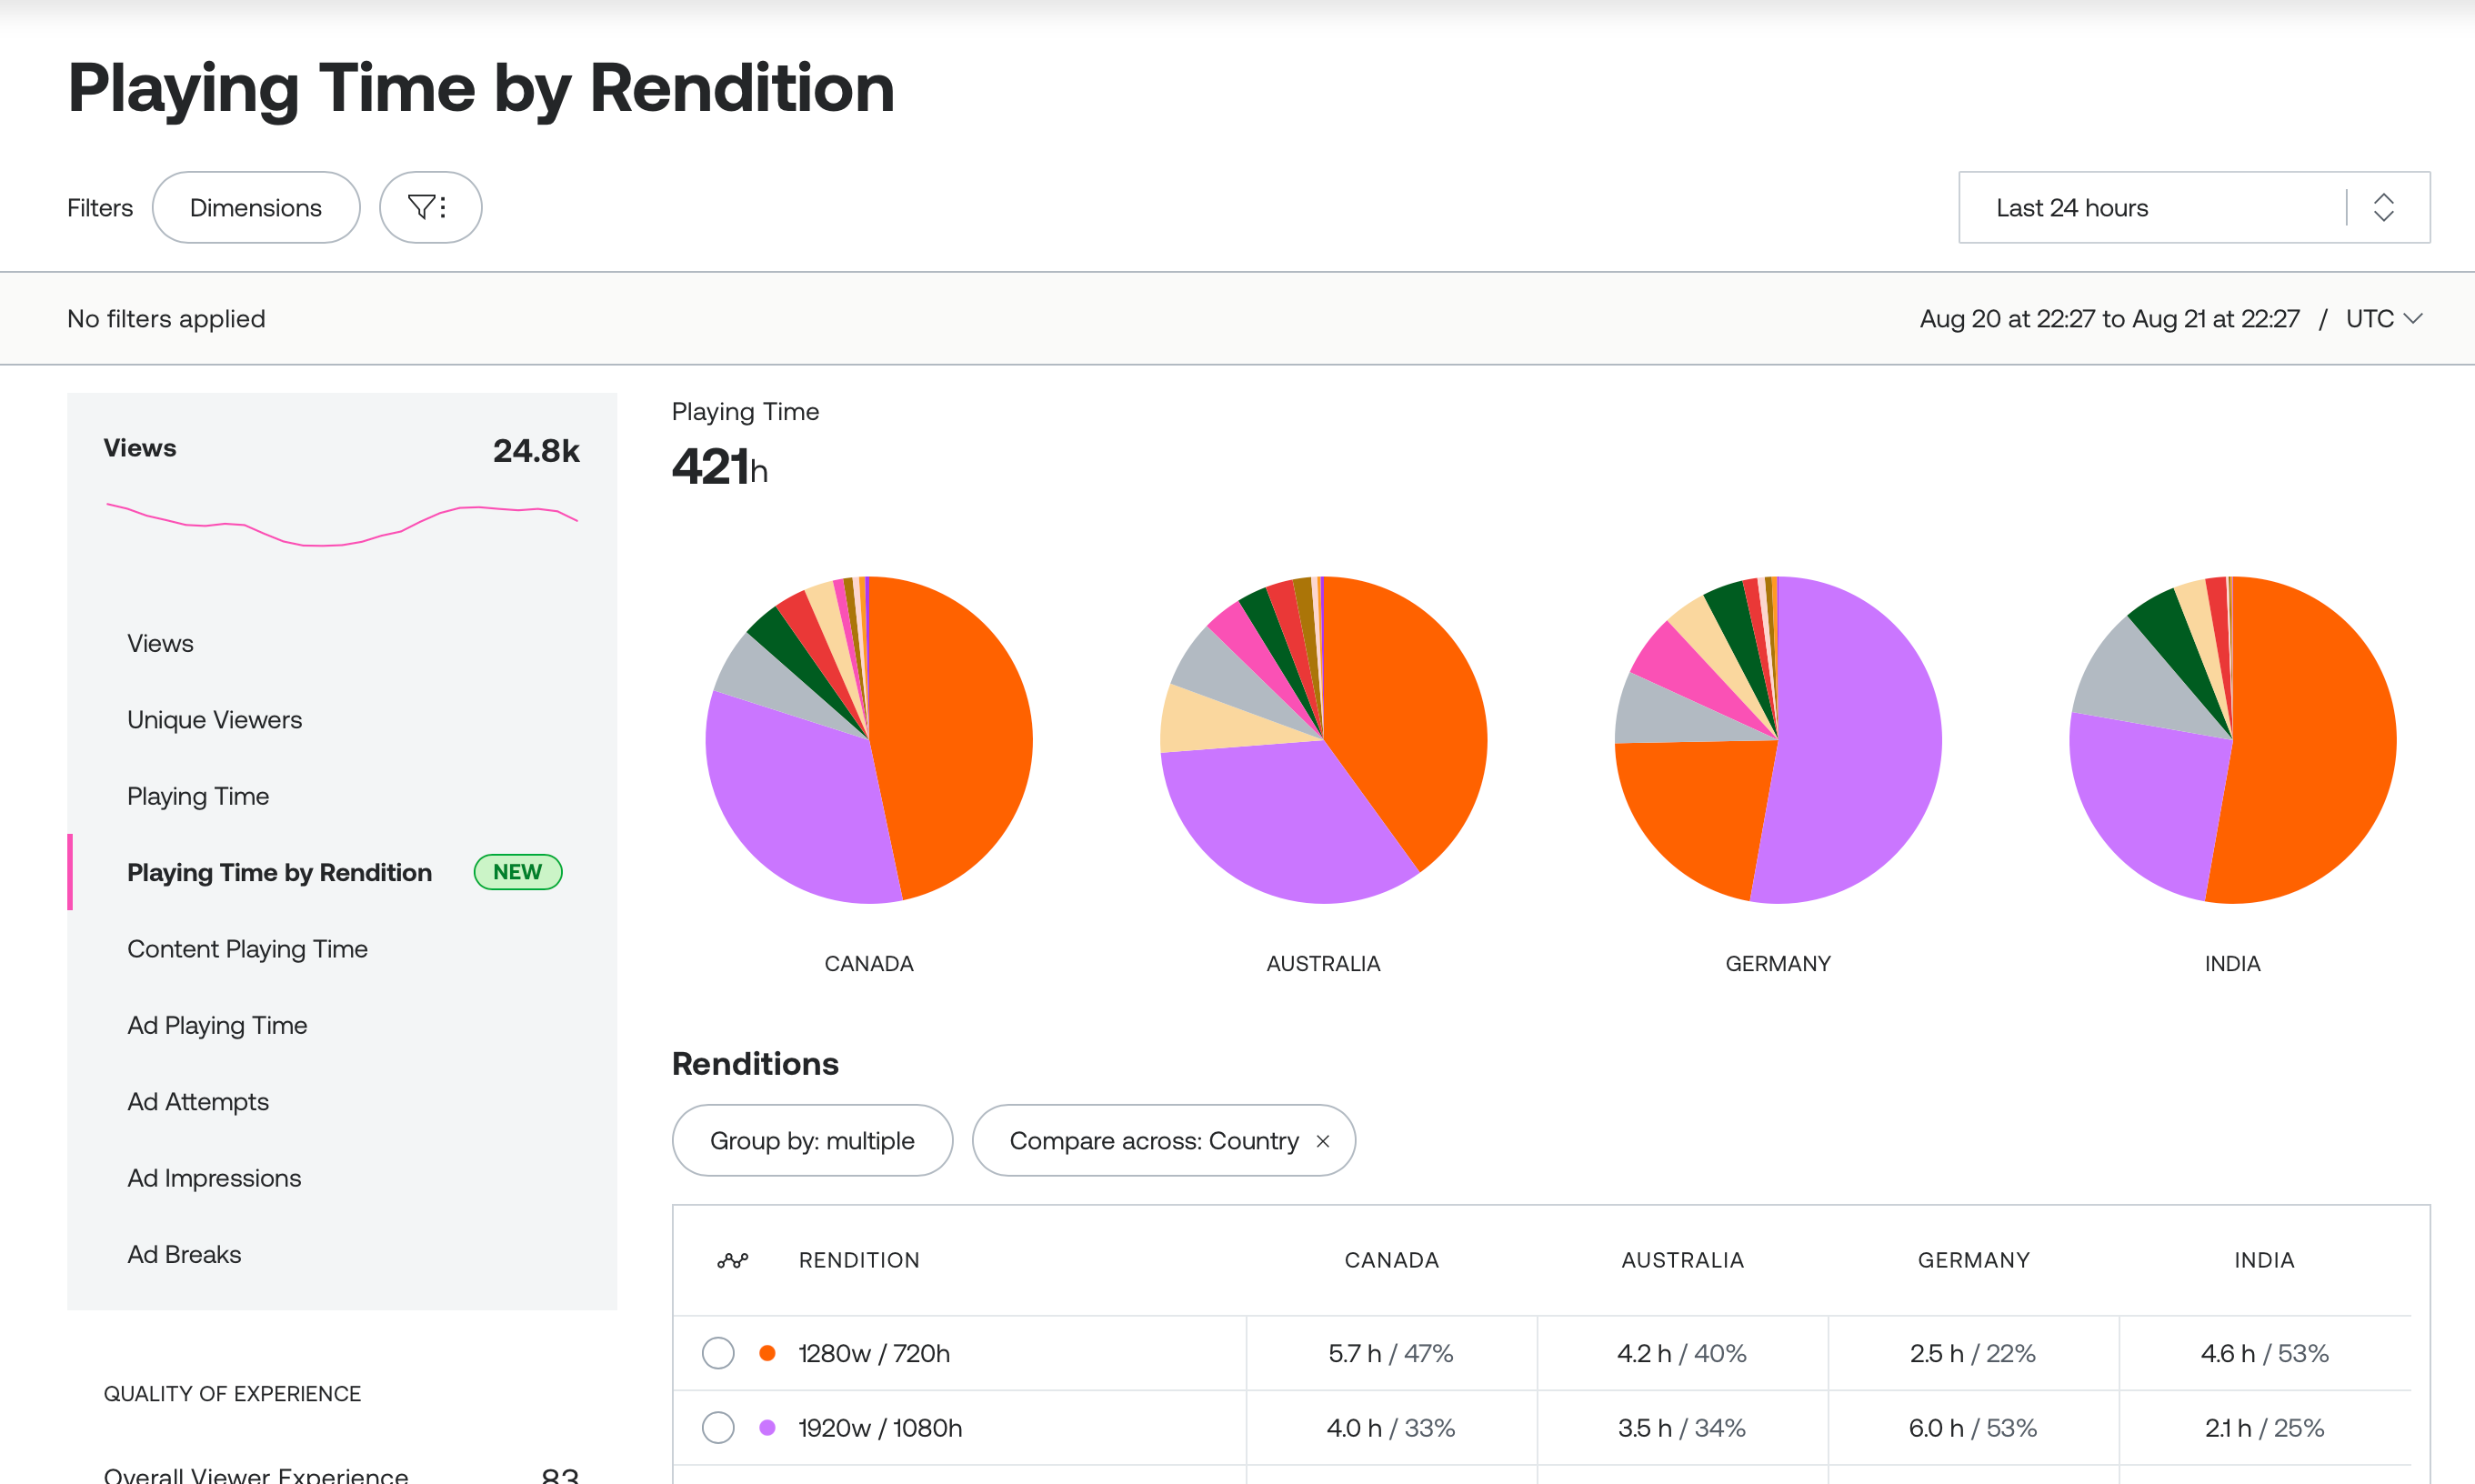
To facilitate deeper cross-regional comparisons, Mux has integrated a "Compare across" feature. This tool allows platform administrators to place viewing behavior side-by-side across multiple geographic territories or operating systems simultaneously. By comparing countries like Canada, Australia, Germany, and India through intuitive pie charts and comparative tables, engineering leads can observe how disparate network environments directly dictate the real-world rendition mix delivered to end-users. Such insights are invaluable when negotiating content delivery network (CDN) contracts, planning regional infrastructure investments, or optimizing edge-caching strategies to ensure maximum performance close to the end consumer.
Customizing Rendition Grouping for Precision Analysis
Recognizing that different engineering teams have distinct analytical priorities, Mux has designed the rendition analytics dashboard with high levels of customizability. By default, the system groups renditions by every parameter reported by the client player: height, width, frame rate, bitrate, video codec, and specific rendition labeling. However, analysts are not locked into this hyper-detailed view.
Through the "Choose rendition parameters" configuration modal, users can selectively narrow down the grouping criteria. A video engineer primarily interested in spatial resolution rather than subtle bitrate fluctuations can choose to group data exclusively by video width and height. Under this configuration, all viewing sessions utilizing a 1280×720 resolution are consolidated into a single unified category, regardless of whether individual players requested a 1.5 Mbps or a 2.5 Mbps variant. This flexibility empowers teams to answer specific operational questions without getting overwhelmed by excessive data noise. It allows streaming architects to identify underutilized rungs on their bitrate ladders, spot redundant encoding profiles that drain cloud storage without adding visible quality, and evaluate whether adjusting ingest settings—such as setting a lower max_resolution_tier—might yield more efficient bandwidth utilization without degrading the viewer experience.
Broader Industry Implications and the Future of Video Analytics
The launch of rendition-level playing time tracking arrives at a crucial juncture for the digital media industry. As streaming platforms face mounting economic pressures to optimize operational expenditures, reduce cloud storage footprints, and minimize egress bandwidth costs, efficiency has become just as critical as raw video quality. Historically, streaming providers often over-engineered their encoding ladders, generating an excessive number of intermediate resolution steps out of an abundance of caution, hoping to cover every conceivable network scenario.
Data-driven insights from platforms like Mux expose the inefficiencies in this traditional approach. If analytics reveal that an intermediate rendition tier accounts for less than one percent of total viewing time across millions of playback hours, platform engineers now possess the empirical justification to deprecate that specific rung from their encoding profiles. Conversely, if data indicates that a substantial portion of an audience hovers right on the threshold between two resolution tiers, teams can fine-tune their ABR ladder steps to provide a smoother, higher-quality transition zone, directly mitigating unnecessary quality drops.
As video providers increasingly embrace sustainability initiatives to lower the carbon footprint of digital media delivery, optimizing bitrates and eliminating wasted bandwidth align corporate efficiency goals with environmental responsibility. Delivering only the renditions that provide tangible value to the viewer minimizes needless data transmission across backbone networks and edge servers alike.
Availability and Getting Started
The "Playing time by rendition" feature is fully integrated into the Mux Data ecosystem and is accessible immediately to current subscribers. Platform users can navigate to the feature by accessing the Mux Data dashboard, opening the left-hand navigation menu, selecting Data, proceeding to Metrics, and choosing Views, followed by Playing time by rendition. For teams seeking step-by-step implementation instructions or guidance on SDK updates, comprehensive documentation is available via the official Mux guides portal. Furthermore, Mux engineering teams have confirmed that ongoing development efforts are underway to extend these capabilities to platform APIs, enabling automated reporting and integration with third-party business intelligence tools in future releases. With no credit card required to begin exploring the platform, Mux continues to lower the barrier to entry for advanced video analytics, equipping teams of all sizes with the actionable intelligence needed to master the complexities of modern adaptive streaming.