Mastering AI Agent Observability: Optimizing Telemetry Pipelines for High-Volume Environments

The rapid proliferation of autonomous AI coding agents has introduced a significant operational challenge for software engineering teams: the management of massive, unstructured telemetry data. As organizations integrate tools like Claude Code into their CI/CD workflows, they are finding that default telemetry configurations—designed primarily for local debugging—are ill-suited for the high-concurrency demands of production environments. When an AI agent performs a task, it generates a deluge of JSON records, logs, and spans. Without proper filtering, this data creates a “wall of text” that is not only prohibitively expensive to store but also effectively unqueryable. Adnan Rahic of Bindplane by Dynatrace, writing on October 22, 2026, highlighted that the core requirement for observability is not simply reducing data collection, but rather retaining only the information necessary to answer critical business and performance questions.
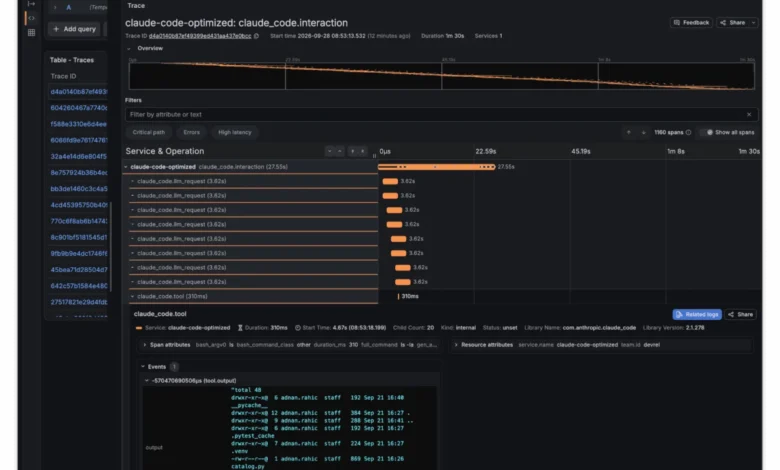
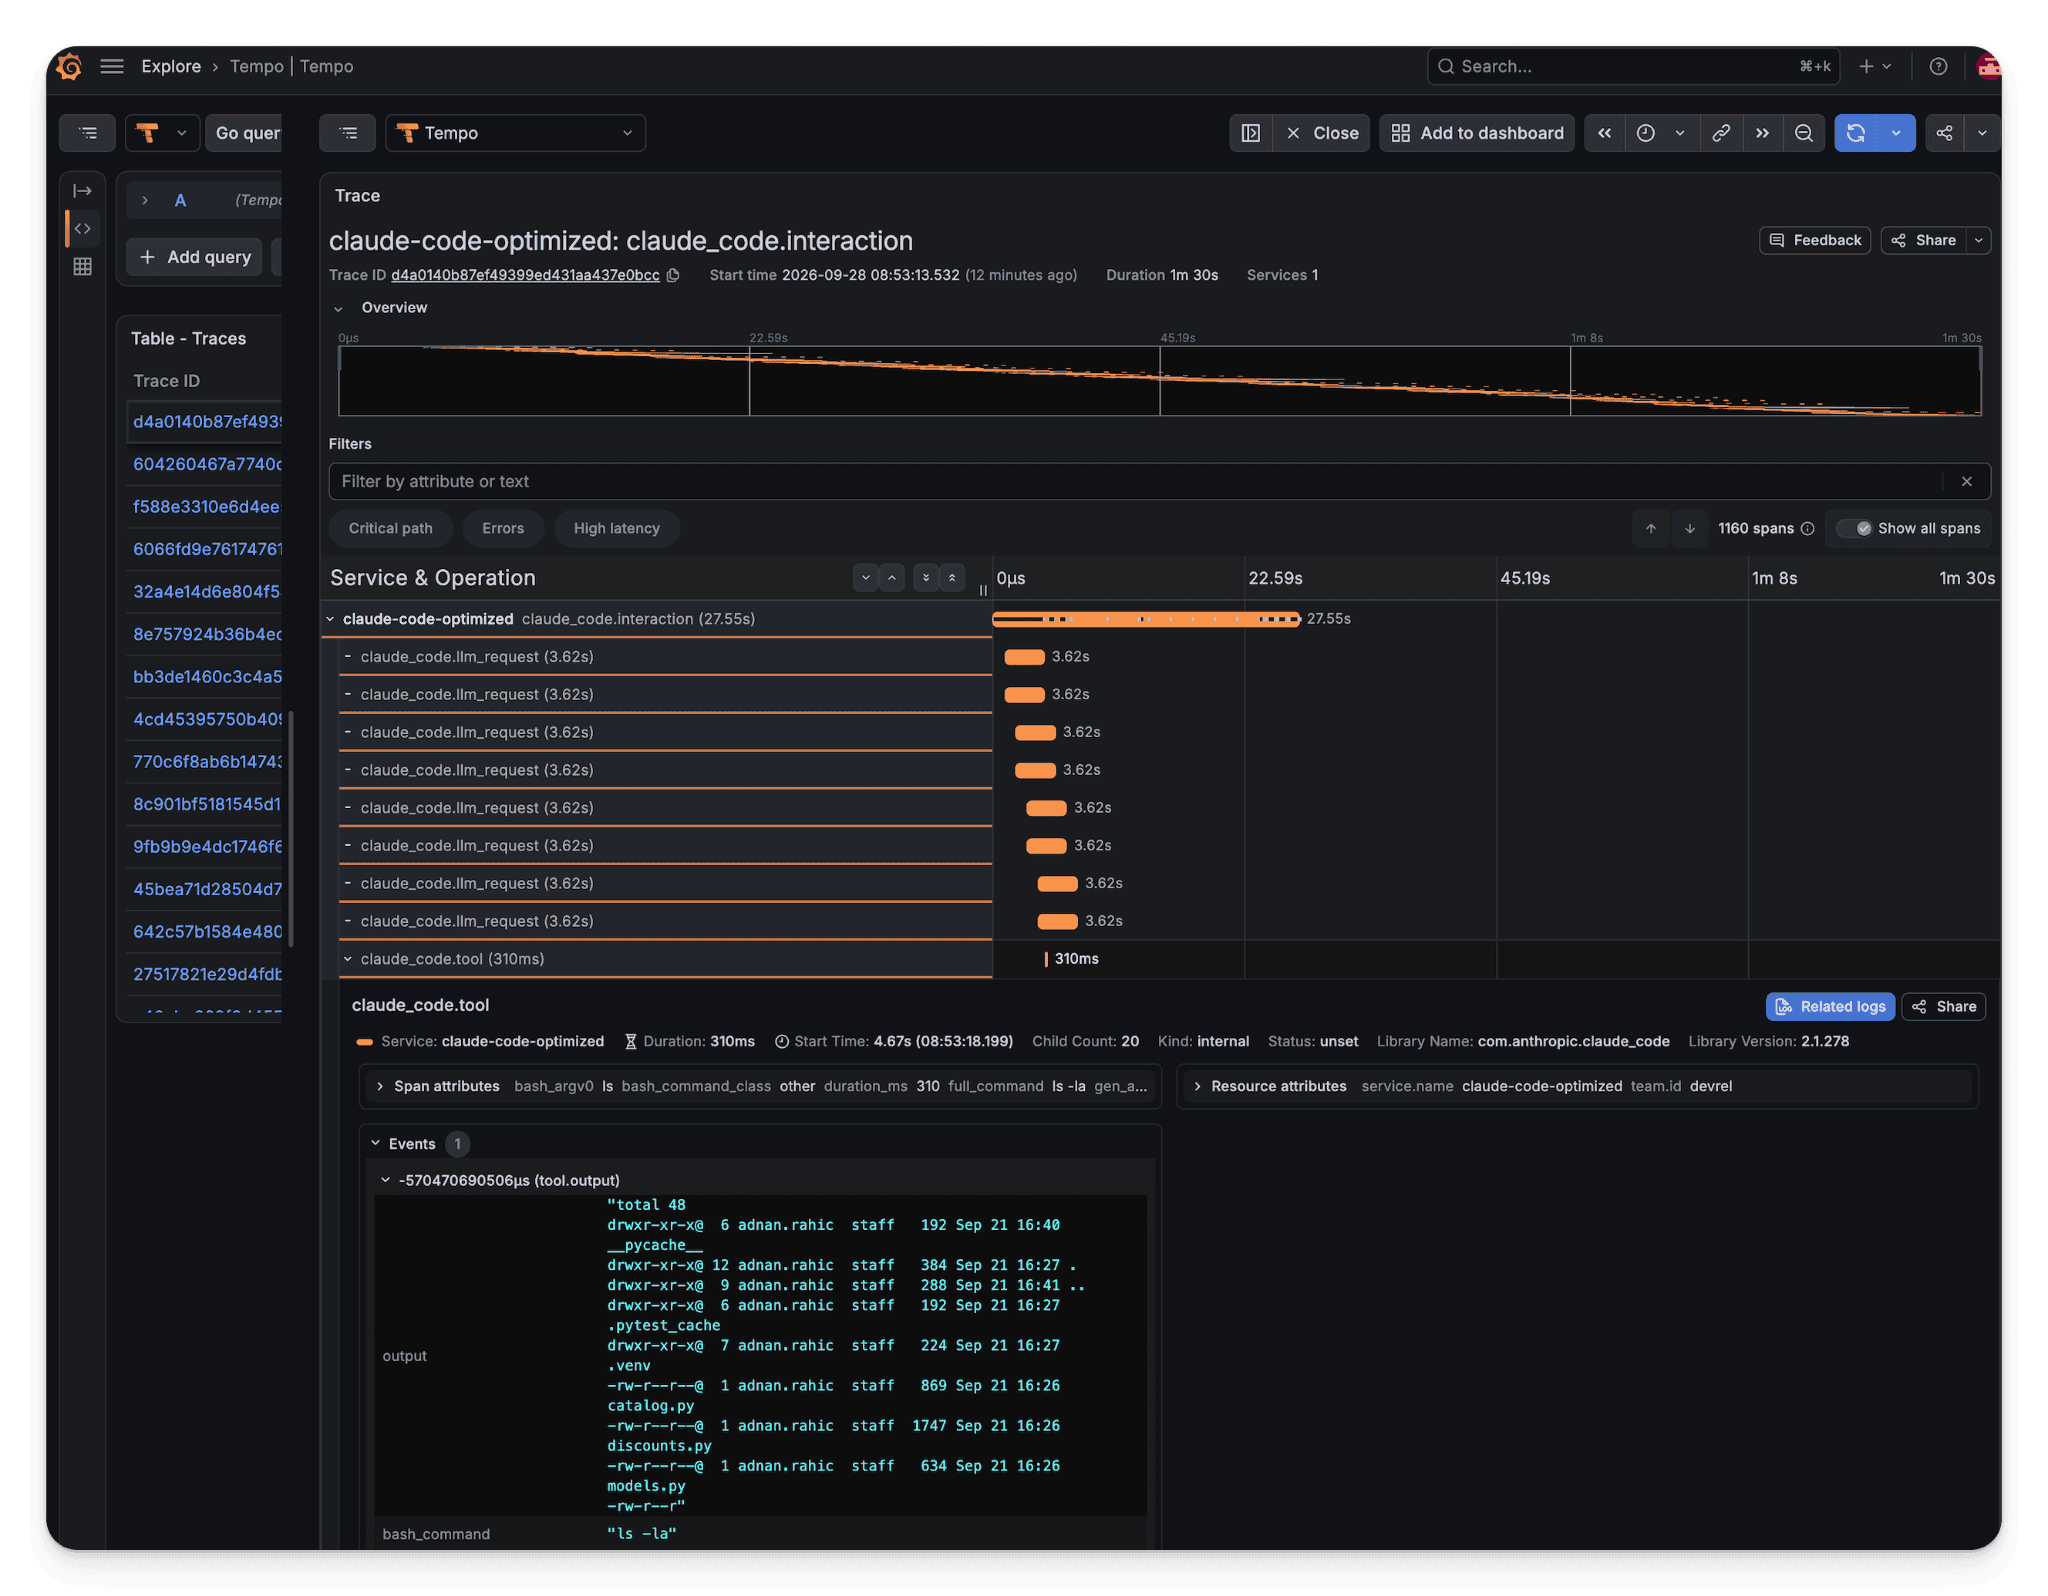
The core of the problem lies in the design of modern agentic instrumentation. Default configurations for agents like Claude Code often log every prompt, file body, diff, and parameter associated with a tool call. For instance, a simple task involving two failing tests and a handful of boundary tests can generate 181 telemetry records and over 289 KB of JSON data. In a scenario where an organization runs 200 sessions a day, this volume quickly scales to gigabytes of low-value, high-cost data that clogs observability backends like Grafana, Datadog, or Honeycomb.
The Shift from Debugging to Fleet Observability
When developers observe a single agent run, verbose logging is an asset. It allows for granular inspection of why a specific tool call failed or why an agent took a particular path. However, when transitioning to a fleet-wide deployment, the paradigm must shift. Telemetry that is not queried, alerted upon, or visualized on a dashboard is not observability; it is simply expensive, indexed storage.
To address this, engineering teams are increasingly turning to the OpenTelemetry (OTel) Collector as a processing layer. By intercepting signals before they reach the backend, teams can reshape, filter, and aggregate telemetry to extract the six essential metrics required for operational health: total model cost per session, token usage (specifically cache hit rates), tool failure rates, agent edit rejection rates, LLM latency (TTFT), and specific API error classifications.
Chronology of the Optimization Strategy
The implementation of an optimized telemetry pipeline typically follows a structured, multi-step process designed to minimize cardinality and byte count without sacrificing signal integrity.
- Pipeline Bifurcation: The initial step involves establishing a dual-pipeline architecture. By using a single OTLP receiver, data is fanned out into a “raw” pipeline (the control group) and an “optimized” pipeline. This allows engineers to conduct an honest comparison of storage costs and performance.
- Log Reduction: Logs often contain the highest volume of redundant data. By utilizing OTel processors, teams can drop non-essential events like
api_requestlogs, which are often redundant. Furthermore, sensitive or verbose fields such astool_parameters,prompt, andresponsecan be deleted. Hashing identifiers likesession.idanduser.idhelps maintain privacy and reduces the cardinality that drives up database costs. - Metric Cardinality Control: Metrics suffer when high-cardinality attributes—like
user.emailorsession.id—are included in every data point. By removing these dimensions and aggregating data into broader buckets, the number of time series can be reduced from hundreds per session to a manageable dozen. This requires careful handling of delta-to-cumulative transformations to ensure that the data remains accurate for Prometheus or other TSDBs. - Trace Trimming: Traces are the largest data consumers. Optimization here focuses on dropping successful tool execution spans while retaining those that result in errors. Additionally, capping the length of content within span events (such as diffs or file outputs) at 512 characters prevents the ingestion of multi-kilobyte files while still providing the necessary context for debugging.
Data-Driven Results and Performance Gains
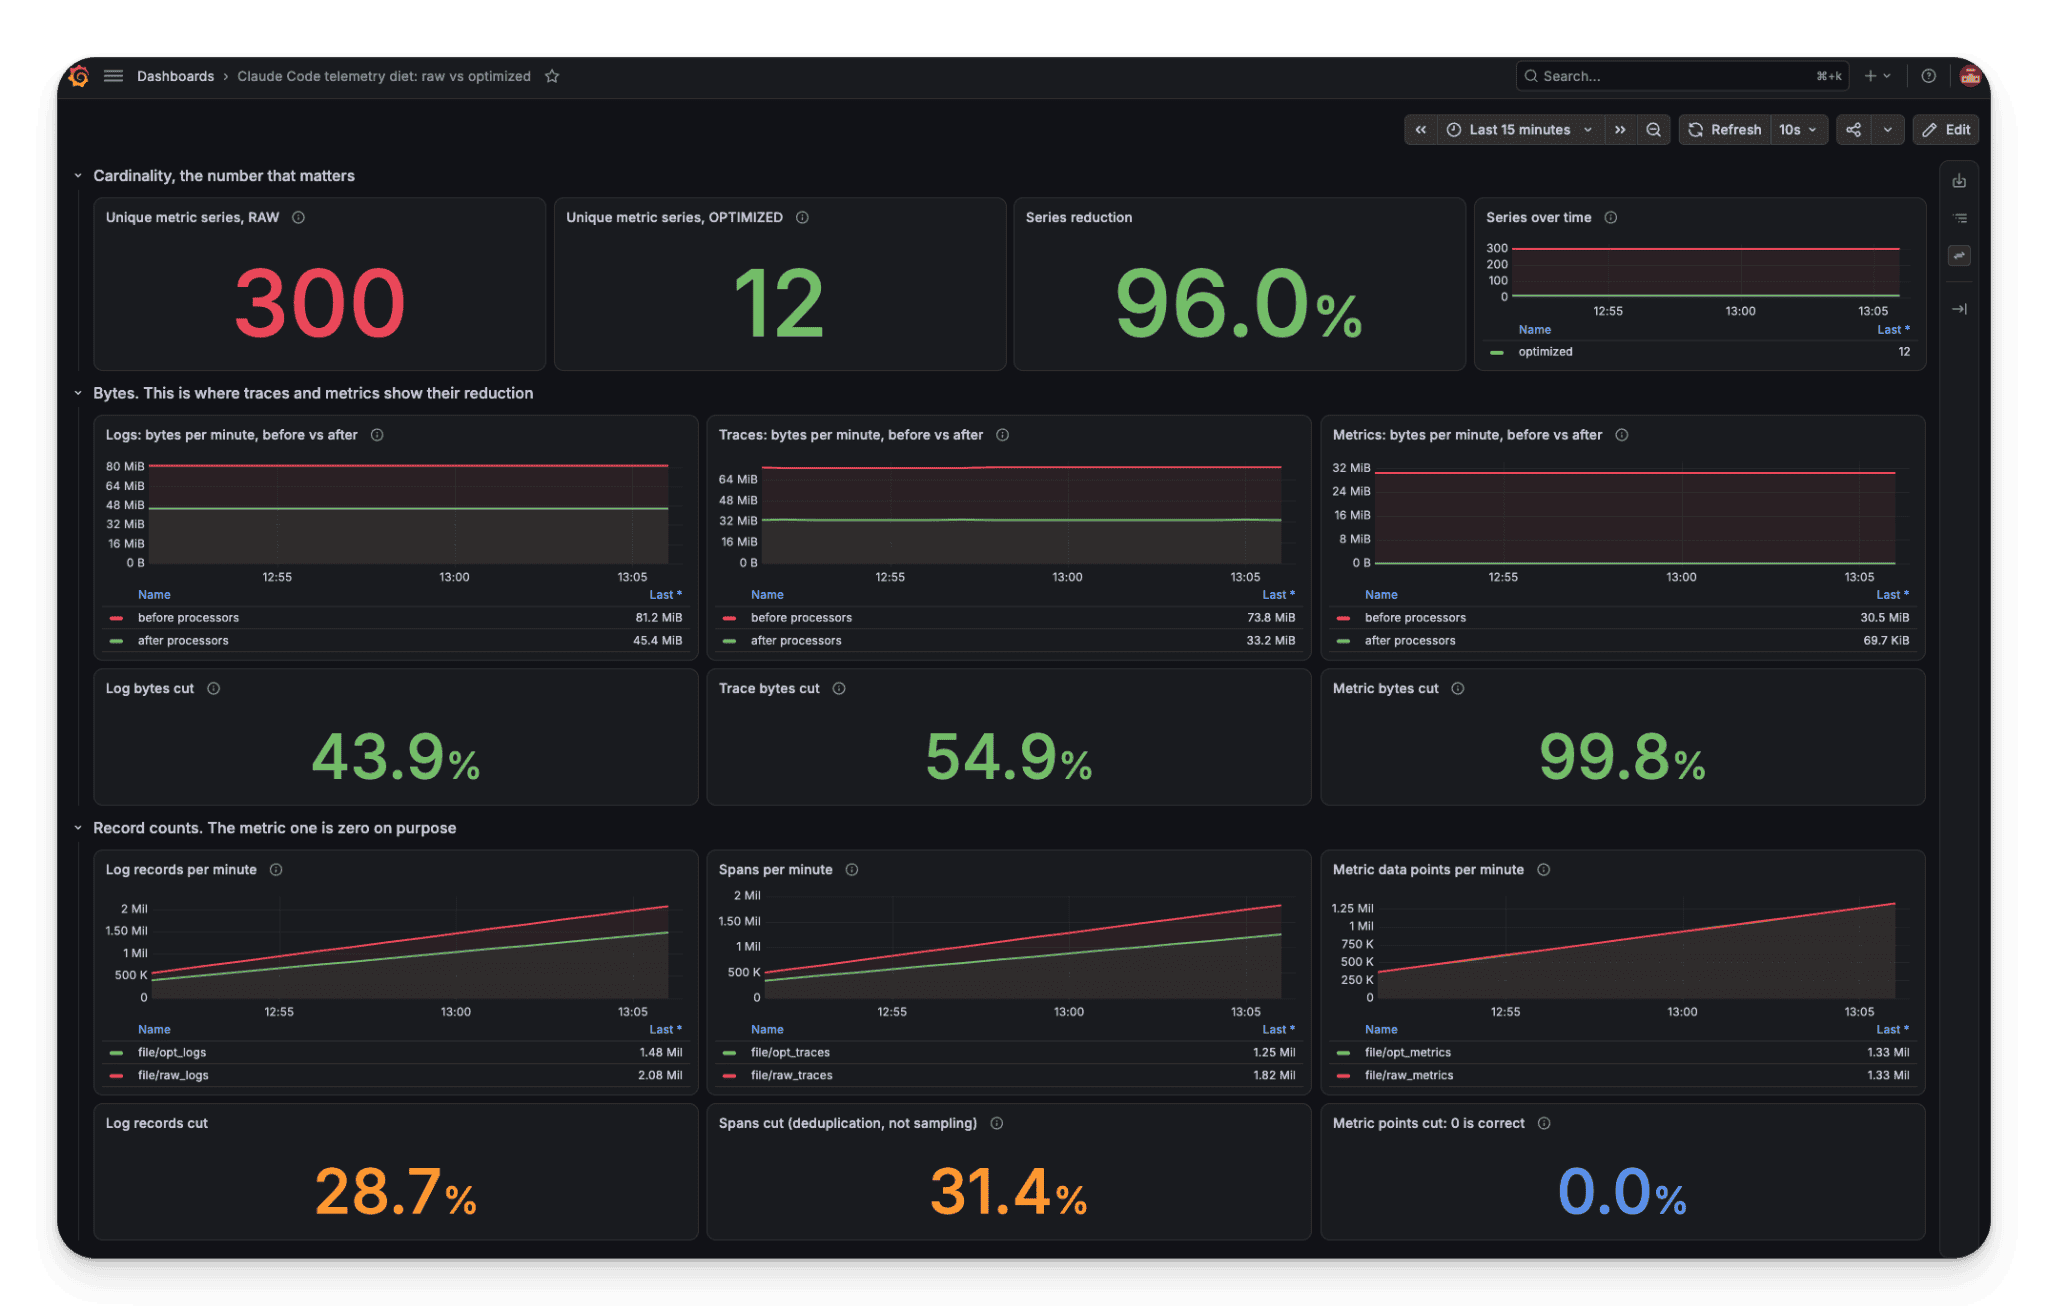
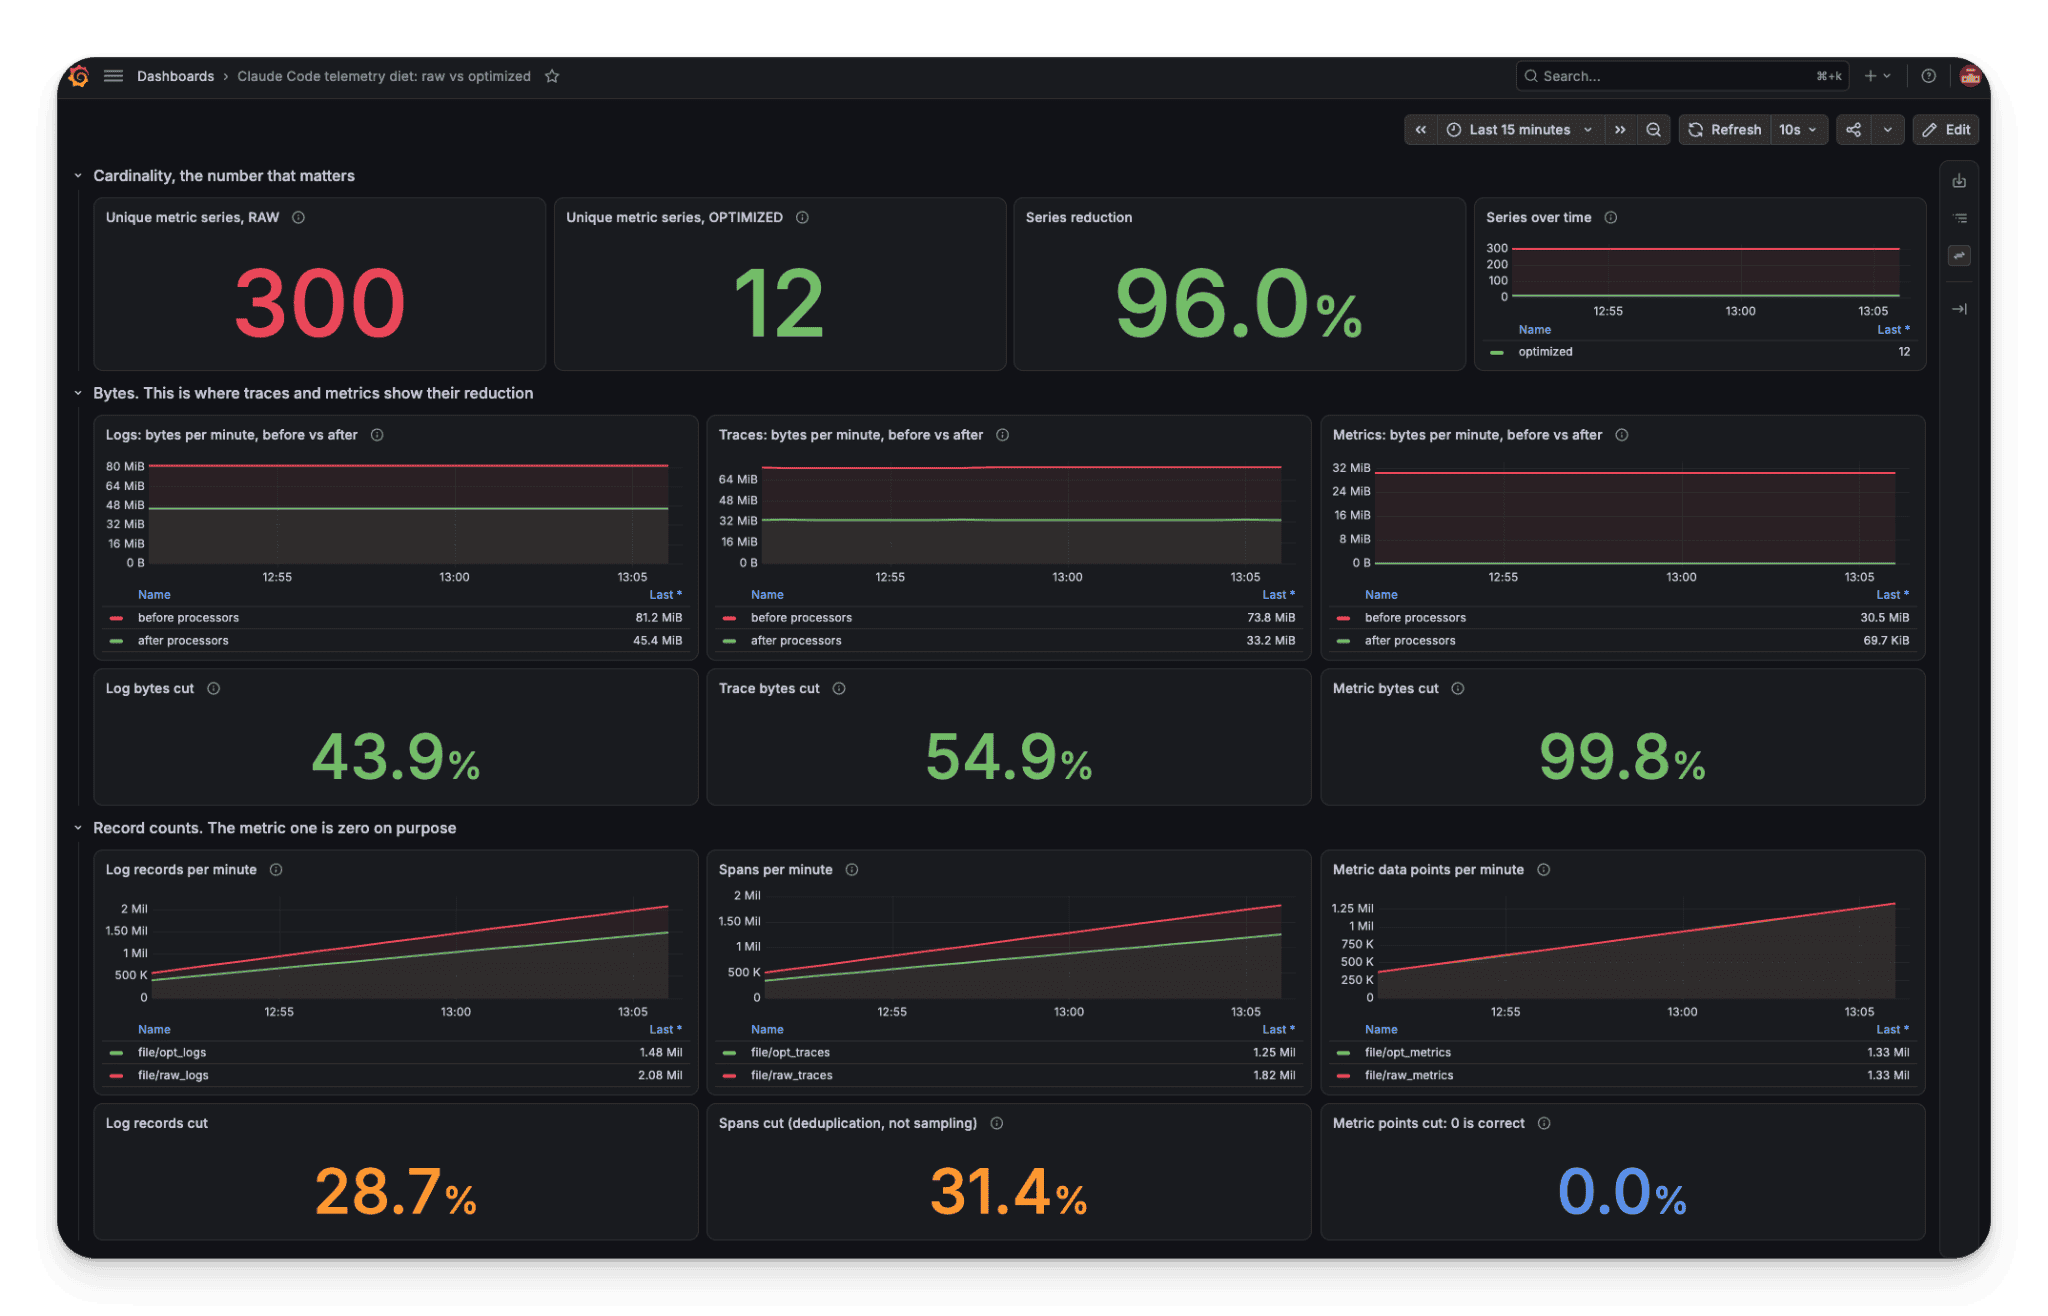
The effectiveness of these strategies is measurable. In comparative tests using a standard Grafana LGTM stack, organizations have seen a significant reduction in data volume—often halving the byte count for logs and traces while maintaining the same level of actionable insight.
For example, when applying the transformation logic to metrics, deleting six specific attributes reduced the time series count for a sample of 25 sessions from 300 series to just 12. Crucially, this reduction does not come at the cost of losing "data." By ensuring the optimized pipeline carries all necessary attributes for high-level dashboarding, the "gap" between the raw and optimized data streams represents pure savings in storage and indexing costs.
Broader Implications for AI Infrastructure
The industry-wide move toward "telemetry shaping" reflects a growing maturity in how enterprises handle AI-driven workflows. As AI agents become ubiquitous in the software development lifecycle (SDLC), the cost of observability will become a major line item in cloud budgets. Industry analysts suggest that companies failing to implement intelligent filtering at the edge will face unsustainable operational overhead as agentic activity increases.
The implications for the OpenTelemetry project itself are also profound. The community is seeing an increased demand for processors that are "AI-aware"—components that understand the structure of LLM requests and can intelligently truncate or summarize data based on semantic relevance rather than just field names.
Official Responses and Best Practices
While vendors like Dynatrace and CNCF contributors continue to refine these patterns, the consensus among infrastructure engineers is clear: the agent should not dictate the telemetry output. It is the responsibility of the platform team to define the "Observability Contract."
When deploying agents into production, teams are advised to adhere to the following principles:
- Always provide a "raw" egress path for critical debugging, but isolate it from the main observability backend to avoid cost spikes.
- Prioritize semantic conventions. Use standard OTel naming for LLM requests (e.g.,
gen_ai.request.model) so that generic dashboards can interpret the data without needing custom Claude-specific logic. - Implement secret guarding. Ensure that pipelines include regex-based filters to scrub potential API keys or tokens from
full_commandfields before they are stored. - Use tail sampling sparingly. While effective for reducing volume, tail sampling can introduce latency in incident response, as the system must wait for a "decision window" before finalizing the trace.
Conclusion: The Future of Agentic Visibility
The challenge posed by AI agent telemetry is not an insurmountable one; it is an architectural opportunity. By treating telemetry as a stream that can be shaped, transformed, and aggregated in real-time, engineering teams can retain full visibility into their AI agents’ performance without the associated financial penalty. As the ecosystem continues to evolve, the ability to discern "what answers questions" from "what fills storage" will define the operational success of the next generation of AI-enabled development environments. The path forward is not to collect less, but to collect smarter.