The question that stopped the meeting: Solving the GPU visibility crisis in multi-tenant Kubernetes environments

It was a routine financial review at Adobe, a standard quarterly check-in where infrastructure costs are scrutinized against operational output. As the slides flickered across the conference room screen, the conversation shifted to the month’s GPU expenditure—a line item that had grown significantly as the organization scaled its AI and machine learning initiatives. One stakeholder posed a deceptively simple five-word question: "Are we using these things?" The silence that followed was heavy, not because of a lack of technical capability, but because of a systemic blind spot. The most expensive hardware in the organization’s possession was effectively invisible to the very teams tasked with utilizing it.
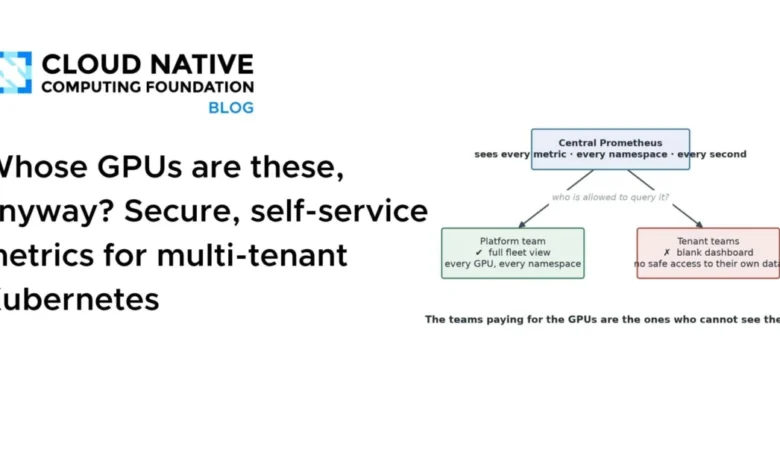
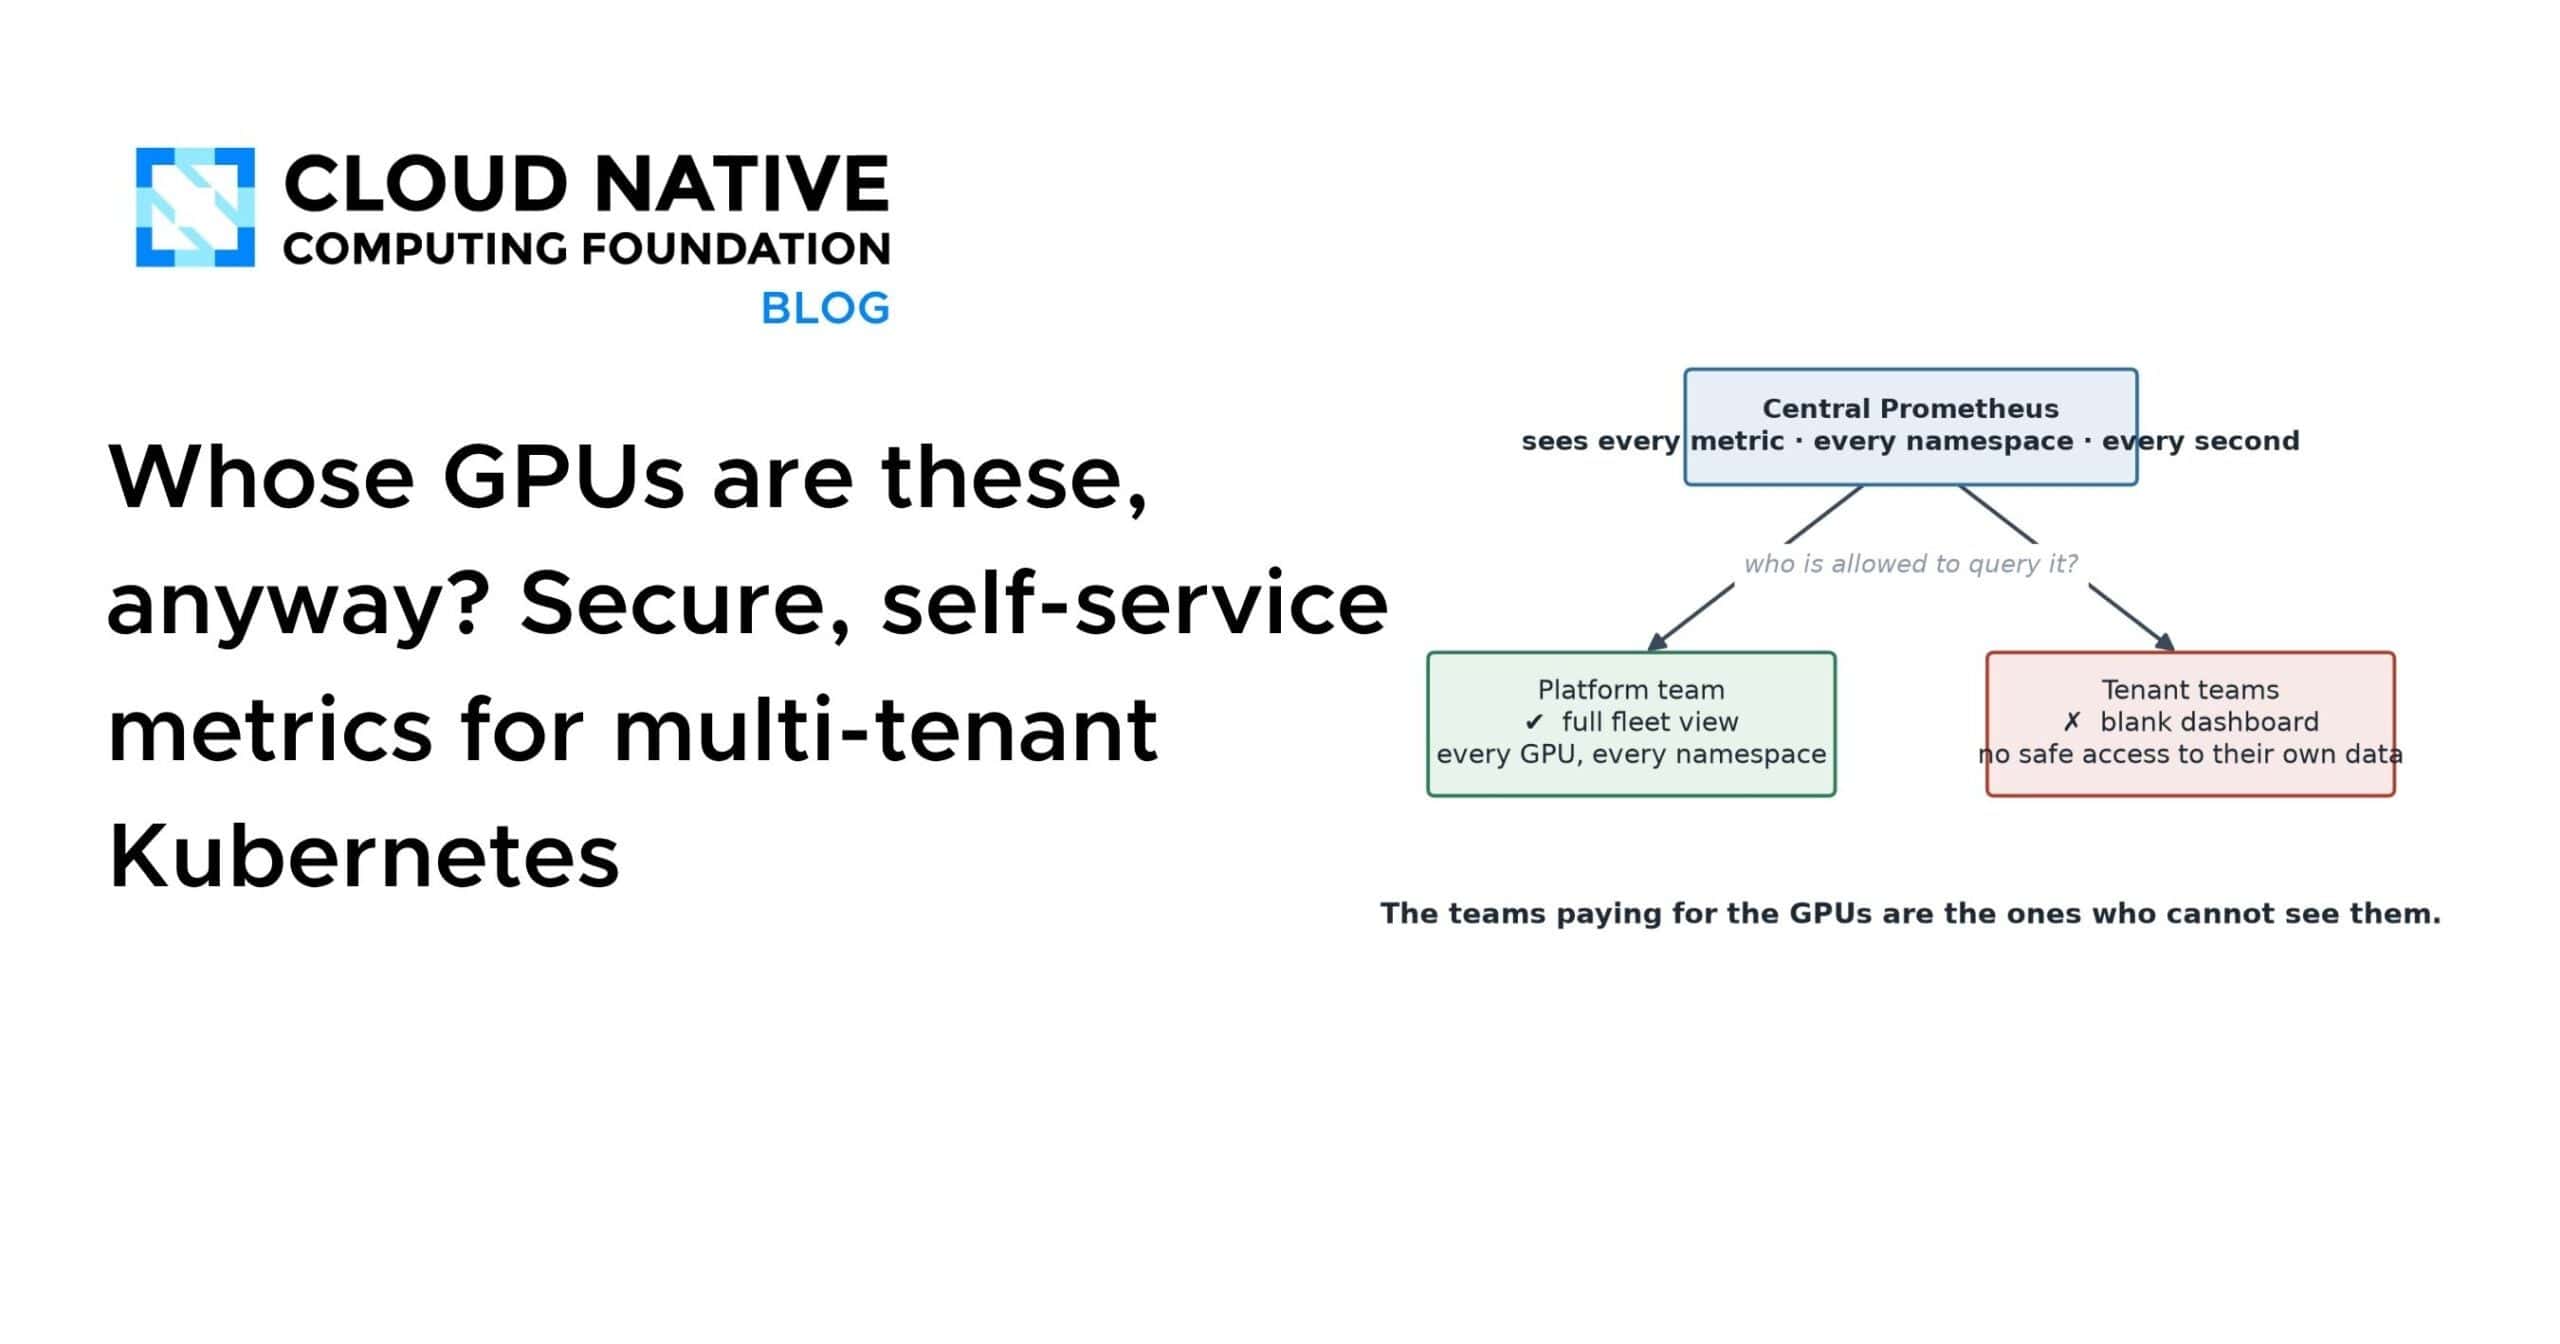
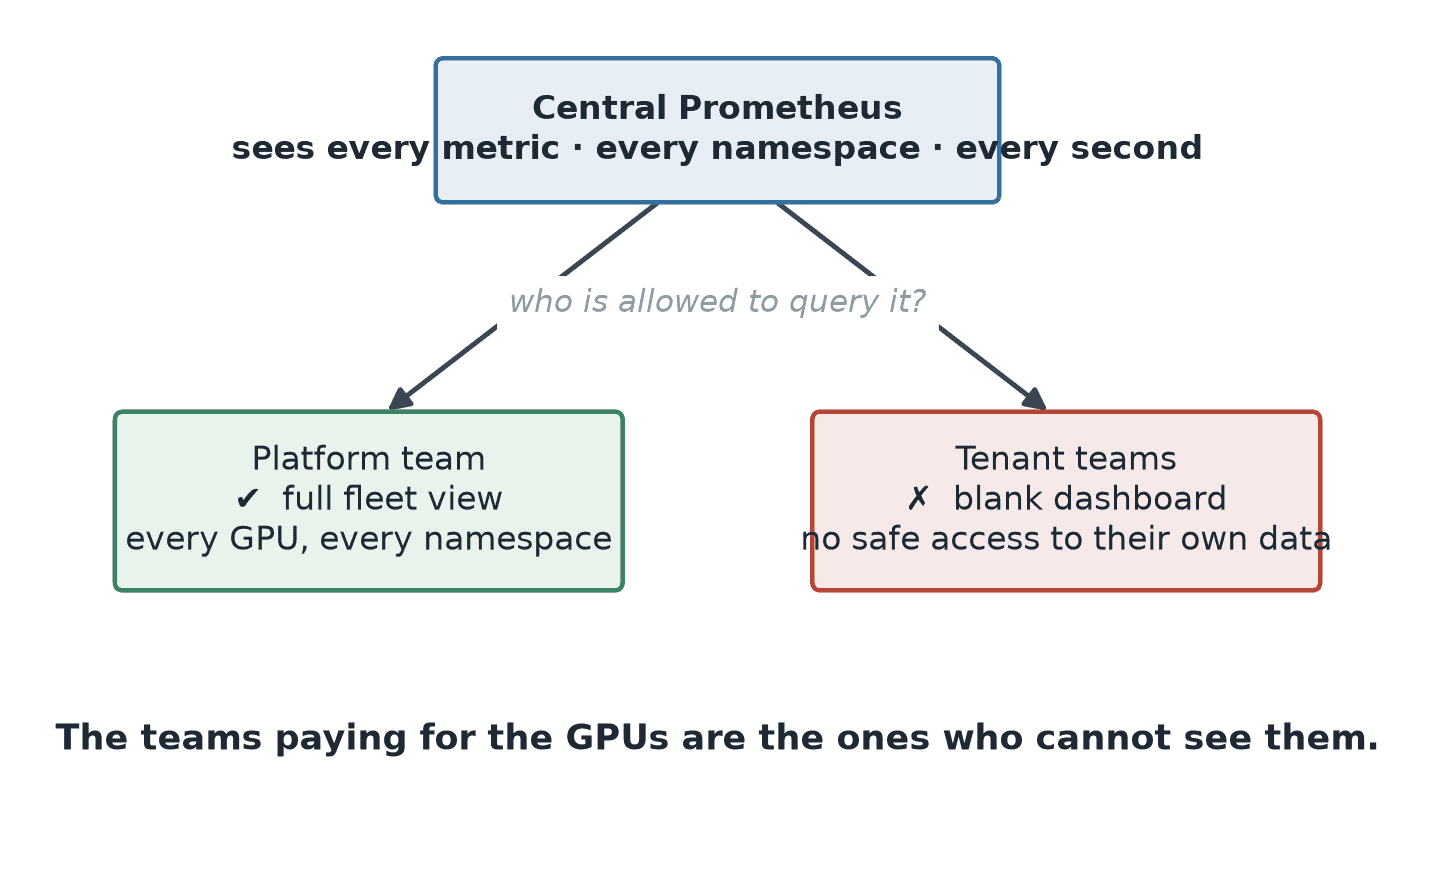
This incident, which occurred in mid-2026, highlighted a growing challenge for platform engineering teams managing large-scale Kubernetes clusters: the "visibility gap." While metrics were being collected at a massive scale by a centralized Prometheus instance, they were inaccessible to individual development teams. This was not a failure of logging, but a structural consequence of security and scalability mandates.
The Anatomy of the Visibility Gap
In a modern cloud-native environment, infrastructure-wide monitoring is typically centralized. By design, a central Prometheus instance scrapes thousands of namespaces, aggregating data from every corner of the cluster. However, providing direct access to this repository creates two primary risks. First, security and isolation: standard Prometheus lacks granular, namespace-aware query authorization. Granting a user access to the query endpoint essentially grants them access to the entire cluster’s metadata, including sensitive capacity plans and utilization rates of other teams. Second, the "noisy neighbor" effect: in a shared environment, an intensive, poorly optimized range query from one team can spike the latency for the entire monitoring stack, impacting the stability of critical infrastructure alerts.
For months, this reality forced a trade-off. Platform teams held the keys to the data, but lacked the domain-specific knowledge to interpret it, while development teams—the actual users of the GPUs—had the context to optimize workloads but no access to the metrics. This imbalance led to the discovery of GPU resources sitting at zero percent utilization for eleven consecutive days, hidden behind "healthy" status checks that masked deep-seated inefficiency.
Chronology of the Infrastructure Shift
The path to a solution began in the early months of 2026, as GPU costs began to outpace traditional CPU-based infrastructure. The platform engineering team at Adobe, led by Golden Kubestronauts Bingi Narasimha Karthik and Ramkumar Nagaraj, identified the necessity for a "tenant-centric" approach.
By early spring, the team initiated an internal audit to map out where visibility was being lost. The audit revealed that 40% of GPU-enabled pods were under-utilizing their assigned hardware, yet the teams were unable to diagnose the issue because the telemetry was locked in a monolithic Prometheus. By June 2026, the team moved away from the idea of "opening" the central store and began prototyping a proxy-based architecture. By September 2026, the solution—a multi-tenant proxy designed to provide isolated, self-service metric access—was fully deployed across their production clusters.
Technical Architecture and Security Design
The solution hinges on a "librarian" model: instead of allowing tenants to browse the entire library of cluster metrics, a proxy intercepts requests, retrieves only the specific data requested by the tenant, and validates it against pre-defined policies.
The architecture relies on three primary components to maintain security and performance:
- Authentication and Authorization: Leveraging
kube-rbac-proxy, the system uses Kubernetes-native identity and Role-Based Access Control (RBAC). This ensures that a tenant’s identity is established and anchored as a namespace assertion before any downstream requests occur. - Query-Time Isolation: To prevent cross-tenant data leakage, the team implemented
prom-label-proxy. This component automatically injects a namespace matcher into every incoming query. If a user attempts to run a query, the proxy modifies it toquerynamespace="target-namespace", rendering it impossible for a user to query metrics outside of their assigned scope. - Collection-Time Isolation: For teams requiring further efficiency, the architecture allows for
metricIsolation. When enabled, the proxy filters metrics during the collection phase, ensuring that only the specific time-series data relevant to a namespace is stored in that tenant’s dedicated Prometheus instance.
This design provides a substantial performance advantage. Data indicates that for a typical tenant, this configuration results in a 97% reduction in stored series—shrinking the data footprint from over 10,000 series to just a few hundred. This reduction significantly improves query speed and lowers storage costs, effectively eliminating the noisy-neighbor issue by distributing the load across smaller, isolated data stores.
Impact on Resource Efficiency
The implications of this shift are quantifiable. By granting teams access to their own GPU telemetry, engineers can now run diagnostics that were previously impossible. Key metrics, such as DCGM_FI_DEV_GPU_UTIL, allow developers to distinguish between "busy and memory-bound" workloads and those that are "reserved but empty."
The data also reveals critical operational patterns. For instance, by correlating GPU utilization with ingress traffic rates, teams can now identify "stuck" jobs—situations where GPUs remain hot while external traffic is zero, often indicating a process that has hung but is still consuming expensive hardware cycles. Conversely, identifying high traffic volume alongside idle GPU capacity helps teams detect scheduling failures, where the application is receiving requests but failing to offload tasks to the hardware.
Broader Industry Implications
The strategy employed by Adobe reflects a broader trend in the Cloud Native Computing Foundation (CNCF) ecosystem. As organizations transition from "monolithic" observability to "distributed" or "federated" models, the focus has shifted toward democratizing data without compromising security.
Industry analysts note that this approach addresses the "tragedy of the commons" in infrastructure spending. When resources are shared, the lack of transparency often leads to "resource hoarding," where teams over-provision hardware "just in case" they need it. By providing granular visibility, platform teams can foster a culture of accountability. Teams that can see their own waste are naturally incentivized to optimize, reducing the total cost of ownership (TCO) for the organization without requiring centralized, top-down rationing.
Looking Ahead
The project, which has been open-sourced via GitHub, serves as a blueprint for other organizations struggling with the complexities of multi-tenant observability. The use of standard, CNCF-native components—Prometheus, Kubernetes RBAC, and standard proxy patterns—ensures that the solution remains portable and avoids vendor lock-in.
As of late 2026, the internal reception has been overwhelmingly positive. The "reading room" metaphor used by the engineering team—where every team has its own desk and access to only its own files—has become the standard for how the organization approaches observability. For the platform engineers, the goal was never to build a new tool, but to remove the barriers that prevented existing data from being useful.
The successful implementation of this proxy architecture underscores a vital lesson in platform engineering: that the most effective way to manage complex infrastructure at scale is to give the users the tools to manage their own resources. When developers can finally see the hardware they are paying for, the "mystery" of infrastructure spend begins to disappear, replaced by a data-driven approach to resource management that aligns technical performance with financial sustainability. The GPU utilization gap at the organization has been closed, not through restrictive policies, but through the empowerment of the teams closest to the code.